
Explorer Graphing Calculator Manufacturer,Supplier and Exporter in India
Product Code : EL-C-10637
Jlab Export is a leading Explorer Graphing Calculator Manufacturer,and suppliers in India
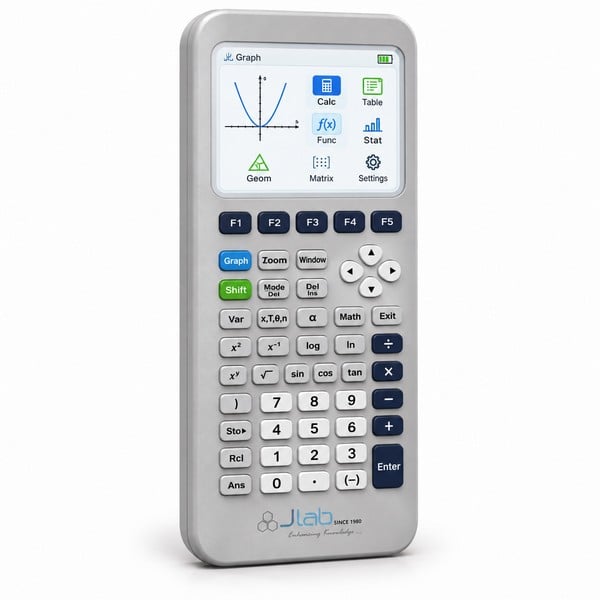
Explorer Graphing Calculator (code EL-C-10637) is a graphing calculator with a 10-digit, 8-line LCD, up to seven graph styles and pre-loaded Area Formulas, Geoboard and Number Line apps, used to introduce students to new concepts and work through advanced maths problems. It runs on four AAA batteries and comes with a hard case and unit-to-unit cable. It is made by Jain Laboratory Instruments Pvt Ltd (JLab) at its works in Ambala, India.
Specifications
| Parameter | Detail |
|---|---|
| Display | 10-digit, 8-line LCD for showing graphs and charts; large screen for scrolling through equations and solutions |
| Graph styles | Up to seven, including animation |
| Graphing and data functions | Zoom, bar plot, pie charts, statistical plot, pictograph and bar charts |
| Pre-loaded apps | Area Formulas, Geoboard, Number Line |
| Fraction and log functions | Fraction simplification, fraction/decimal conversion, log and antilog |
| Other functions | Decimal, random number, trigonometry, radian, degree, factorial, permutation, percent and scroll |
| Symbolic work | Explore maths expressions in symbolic form |
| Memory | 32KB RAM |
| Keys | Colour-coded buttons |
| Power | Four AAA batteries |
| Dimensions (H x W x D) | 1 x 3.5 x 7.3 in (about 2.5 x 8.9 x 18.5 cm) |
| Package content | Hard case and unit-to-unit cable |
| Build | Stands up to the wear and tear of school use |
| Quality check | Each calculator is visually inspected before dispatch |
| Pack quantity | Each (sold individually) |
| Minimum order quantity | 10 units |
| Dispatch time | Usually 7–10 working days |
| Product code | EL-C-10637 |
| Manufacturer | Jain Laboratory Instruments Pvt Ltd (JLab) — OEM |
| Country of origin | India (made in Ambala, Haryana) |
How Does It Compare with the JLab Graphing Calculator?
| Model | Display | Memory | Graphing |
|---|---|---|---|
| Explorer Graphing Calculator (EL-C-10637) | 10-digit, 8-line LCD | 32KB RAM | Up to seven graph styles, including animation; bar, pie, pictograph and statistical plots |
| Graphing Calculator | High-resolution backlit, colour-coded | 3 MB | Rectangular, parametric and polar graphs and recursive sequences |
Choose the Explorer when students are being introduced to graphs and data through pictographs, pie and bar charts, statistical plots and the pre-loaded Area Formulas, Geoboard and Number Line apps. The Graphing Calculator has a high-resolution backlit colour-coded display and 3 MB of memory.
What Is the Explorer Graphing Calculator Used For?
It helps students see the maths behind a formula. With up to seven graph styles, including animation, they can watch a graph being drawn; bar plots, pie charts, pictographs and statistical plots turn class data into charts; and working with expressions in symbolic form helps them spot patterns. The large 8-line screen lets them scroll back through complex equations and solutions, and the colour-coded buttons make the right function easy to find. Fraction simplification, fraction/decimal conversion, log and antilog, trigonometry in radians or degrees, factorials and permutations cover both maths and science work in school.
What to Specify When Ordering
- Model — this Explorer Graphing Calculator or the Graphing Calculator.
- Quantity — for example one per student or a class set for the maths lab.
- Other calculators — Scientific Calculators for other classes can be quoted on the same enquiry.
Frequently Asked Questions
What graphs and charts can it show?
Up to seven graph styles, including animation, with zoom, bar plots, pie charts, statistical plots, pictographs and bar charts on a 10-digit, 8-line LCD.
Which apps come pre-loaded?
Area Formulas, Geoboard and Number Line.
What comes in the package?
A hard case and a unit-to-unit cable come with the calculator.
How is it powered?
It operates on four AAA batteries, which makes it portable.
How big is it?
It measures 1 in high, 3.5 in wide and 7.3 in deep (about 2.5 x 8.9 x 18.5 cm).
How does it differ from the Graphing Calculator?
The Explorer has a 10-digit, 8-line LCD and 32KB RAM with up to seven graph styles; the Graphing Calculator has a high-resolution backlit colour-coded display and 3 MB of memory.
What should an export quotation request include?
The quantity, the destination country and port or city, your preferred delivery terms (for example FOB or CIF), any packing or labelling needs, and the tender reference if applicable.
Who manufactures the Explorer Graphing Calculator?
Jain Laboratory Instruments Pvt Ltd, trading as JLab, makes it at its works in Ambala, Haryana, India.
OEM Manufacturer
JLab is the trading name of Jain Laboratory Instruments Pvt Ltd, a maker of maths lab, science lab and educational equipment in India, incorporated in 2017 and based on Hargolal Road, Ambala, Haryana. The Explorer is produced at JLab’s own works rather than bought from a trader, so schools, dealers and importers buy factory-direct, each calculator is visually inspected before dispatch, and repeat orders are handled by the same maker. JLab exports worldwide and ships to buyers in every region — for example Norway in Northern Europe, Congo in Central Africa, Chile in South America, Eswatini in Southern Africa and Mexico in North America. Tender details are on the JLab lab tenders page.
Other Calculators for Maths and Science Classes
- Graphing Calculator — a backlit colour-coded graphing calculator with 3 MB of memory and a USB port.
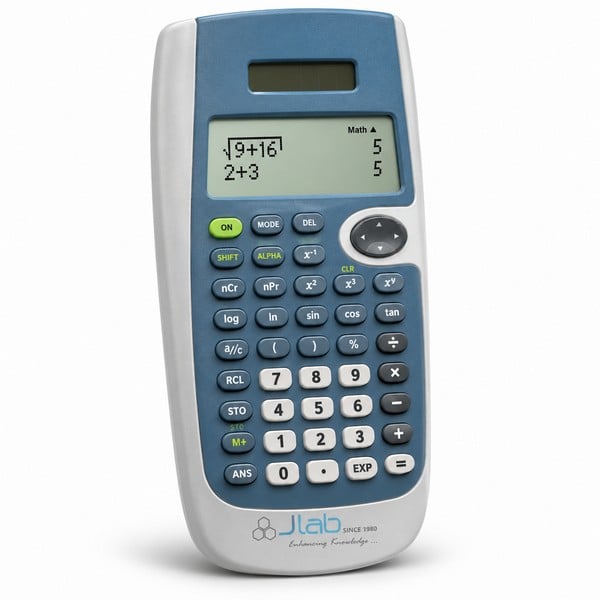
- Scientific Calculator — a two-line scrolling-display calculator with fractions, conversions and two-variable statistics.
- Dual Power Scientific Calculator — solar with battery backup, giving mean and standard deviation on an 8-digit display.
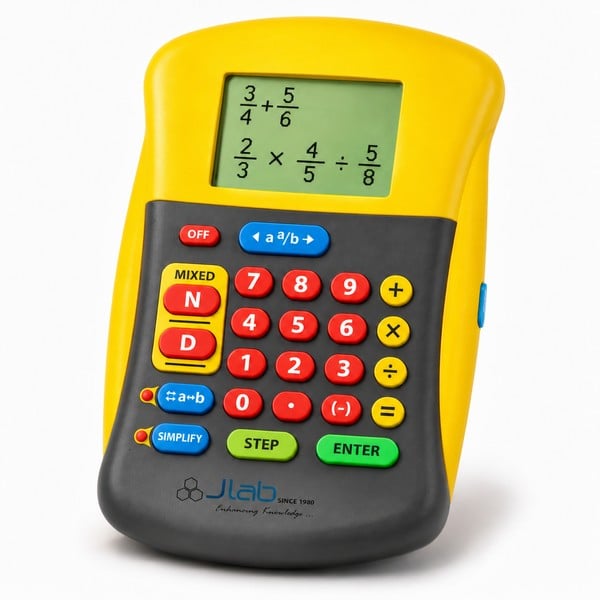
- Fraction Calculator — for adding, subtracting, multiplying and dividing fractions and mixed numbers.
See the complete Calculator range or the full Maths Lab Equipment range.
Request a Quote
Ask for a quotation through the Add To Cart enquiry button on this page or the contact page, stating the quantity and the delivery location.
Last updated: 16 October 2026