Spectrum Analysis Chart JLab Manufacturer,Supplier and Exporter in India
Product Code : JL-PI-832
Jlab Export is a leading Spectrum Analysis Chart JLab Manufacturer,and suppliers in India
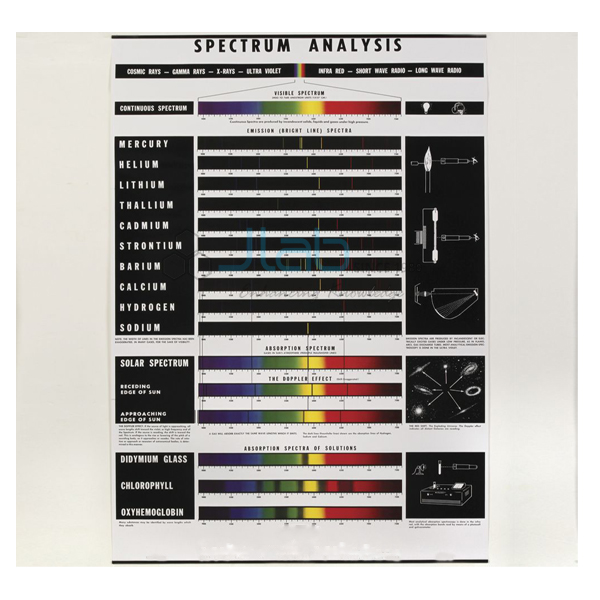
Spectrum Analysis Chart
- This chart shows the visible continuous spectrum of the sun and the emission or bright line spectra of ten relatively common elements.
- It provides an excellent beginning point to show the student the total individuality of the spectrum of each element.
- It then also presents an opportunity to discuss the general relationship between the number of lines and the number of atomic shell electrons.
- Also shown is an explanation of the “red shift” or Doppler Effect which is a change in the perceived frequency, usually of an absorption or Fraunhofer line.
- This change or shift is caused when the light source is moving at high speed toward or away from the viewer.
- Certain materials and solutions will selectively absorb one or more bands of light.
- These characteristic dark bands are very specific and readily identify the material or solution through which the light is passing.
- Absorption bands for didymium glass, chlorophyll and oxyhemoglobin are shown.
- A number of line drawings show how spectra may be produced or clarify other aspects of the importance of spectral analysis.
- This durable chart is printed on heavy paper stock and is fitted with metal binding strips at top and bottom.
- The upper strip includes a tab suitable for wall hanging.
- Dimensions
- 94 cm x 64 cm.