
Gametogenesis in Animals Chart Manufacturer,Supplier and Exporter in India
Product Code : EL-ZC-9314
Jlab Export is a leading Gametogenesis in Animals Chart Manufacturer,and suppliers in India
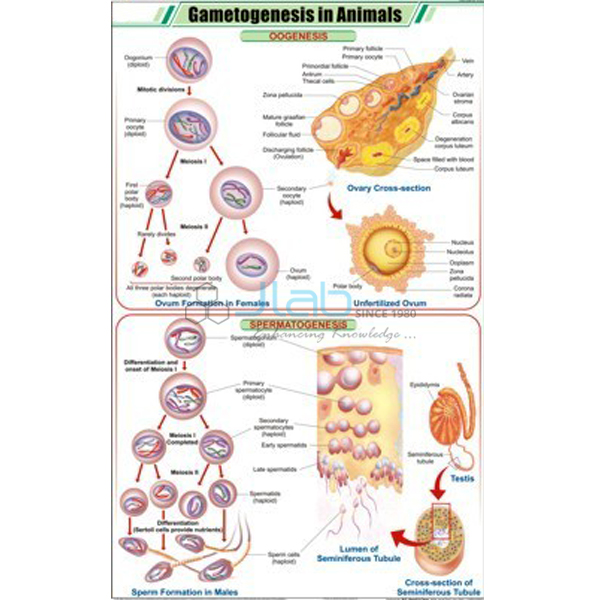
Gametogenesis in Animals Chart (code EL-ZC-9314) is a 58 x 90 cm wall chart for teaching how sperm and egg cells are formed — spermatogenesis and oogenesis — in class 12 biology and college zoology. It is printed in full colour on art paper, laminated on both sides with thick plastic film and fitted with plastic rollers; the text is English only. JLab (Jain Laboratory Instruments Pvt Ltd, Ambala, India) supplies it to schools, colleges and dealers.
Get a quote: use the Add To Cart enquiry button below, or send your quantity and destination through the contact page.
Specifications
| Parameter | Detail |
|---|---|
| Chart topic | Gametogenesis (spermatogenesis and oogenesis) |
| Size | 58 x 90 cm (about 22.8 x 35.4 in) |
| Printing | Full colour on art paper |
| Lamination | Both sides, thick plastic film |
| Fittings | Plastic rollers |
| Language | English only |
| Quality check | Each chart is visually inspected before dispatch |
| Pack quantity | Each (sold individually) |
| Minimum order quantity | 10 units |
| Dispatch time | Usually 7–10 working days |
| Product code | EL-ZC-9314 |
| Supplied by | Jain Laboratory Instruments Pvt Ltd (JLab), Ambala, India |
What Is the Gametogenesis in Animals Chart Used For?
Gametogenesis is the making of gametes in the gonads, and it is a core part of the class 12 chapter on human reproduction. In the testis, spermatogenesis takes place in the seminiferous tubules: spermatogonia multiply by mitosis and grow into primary spermatocytes, which pass through meiosis I to give secondary spermatocytes and through meiosis II to give spermatids; the spermatids are then reshaped into tailed spermatozoa, supported by Sertoli cells. In the ovary, oogenesis begins with oogonia that become primary oocytes and pause in the first meiotic division inside follicles. Each primary oocyte that resumes development divides unequally into a large secondary oocyte and a small first polar body, and the second meiotic division is completed only after a sperm enters, giving the ovum and a second polar body.
The two processes are easiest to understand side by side, which is what a wall chart allows: one primary spermatocyte yields four sperm, while one primary oocyte yields a single ovum. Teachers use the chart while explaining the flow-chart diagrams students must reproduce in examinations, and it links the cell division chapter with fertilisation and embryo development. Wipe the laminated surface clean and roll it up between terms. The artwork is not described in the listing, so ask JLab for a larger image if you need to check the stages shown.
What to Specify When Ordering
- Quantity required — the minimum order is 10 units, supplied as separate charts.
- Related charts — fertilisation and meiosis charts from the same series complete the reproduction unit.
- Models and slides — a spermatogenesis model or sperm slide can be added for practical classes.
- Delivery — destination city and country, plus port and delivery terms (for example FOB or CIF) for export orders.
Frequently Asked Questions
What does this gametogenesis chart help explain?
It helps explain how sperm form in the testis and eggs form in the ovary through mitosis, meiosis and maturation. The artwork is not described in the listing; the product photograph shows the chart, and JLab can send a larger image.
What are the size and finish?
The chart is 58 x 90 cm (about 22.8 x 35.4 inches), full colour on art paper, laminated on both sides with thick plastic film and fitted with plastic rollers.
How does spermatogenesis differ from oogenesis?
Spermatogenesis divides the cytoplasm equally and turns each primary spermatocyte into four small, mobile sperm. Oogenesis divides it unequally, so each primary oocyte gives one large ovum, rich in stored food, and small polar bodies.
What are polar bodies?
They are the small cells cast off during the two meiotic divisions of oogenesis. They carry away the spare sets of chromosomes, letting the egg keep almost all the cytoplasm, and they normally degenerate.
What is the minimum order and dispatch time?
Ten units, sold singly, is the minimum. Orders normally leave within 7–10 working days after each chart is checked by eye; the export transit time depends on the destination.
Who supplies the chart?
Jain Laboratory Instruments Pvt Ltd, trading as JLab, supplies it from Ambala, Haryana, India and handles quotations directly.
Supplier
JLab is the trading name of Jain Laboratory Instruments Pvt Ltd, a company incorporated in 2017 on Hargolal Road, Ambala, Haryana, which supplies teaching and laboratory equipment to schools, colleges and universities. Besides its own equipment range it offers zoology charts such as this one to schools, colleges, dealers and importers, inspects each chart by eye before packing and deals with repeat orders directly. JLab exports worldwide and reaches buyers in every region — for example Paraguay in South America, New Zealand in Oceania, Eswatini in Southern Africa, South Korea in East Asia and the USA in North America. Tender buyers can refer to the JLab lab tenders page.
Reproduction Charts, Models and Slides
- Spermatogenesis Model — shows the process from the start of spermatogenesis to the mature spermatozoon, in PVC on a stand.
- Male Sperm Prepared Slide — a prepared slide for viewing sperm under the microscope.
- Human Sperm Model — an enlarged sperm model mounted on a base.
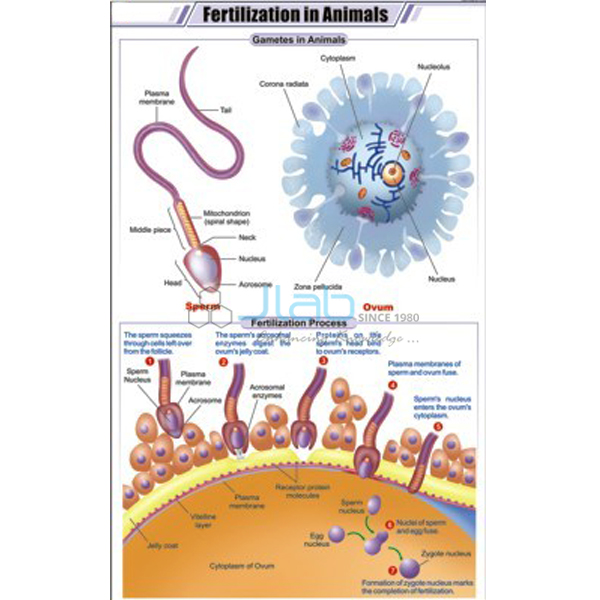
- Fertilization in Animals Chart — the next step, when sperm and egg fuse.
- Animal Cell Meiosis Chart — the cell division on which gametogenesis depends.
See all titles in the Zoology Chart range or the full Charts range.
Request a Quote
To get a quotation from JLab, use the Add To Cart enquiry button on this page or send the quantity (minimum 10 units), any companion charts, models or slides and your delivery city and country through the contact page.
Last updated: 3 October 2026