
Petroleum and Natural Gas Manufacturer,Supplier and Exporter in India
Product Code : EL-GSC-2951
Jlab Export is a leading Petroleum and Natural Gas Manufacturer,and suppliers in India
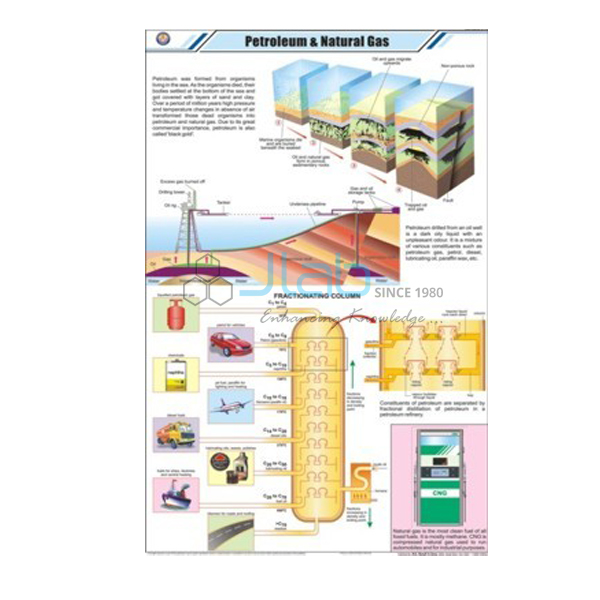
Petroleum and Natural Gas (code EL-GSC-2951) is a 58 x 90 cm wall chart for lessons on how petroleum and natural gas form underground, how they are extracted and how crude oil is refined into everyday fuels and materials. It is offset printed in full colour on 130 gsm coated art paper, laminated on both sides and fitted with plastic rollers. JLab (Jain Laboratory Instruments Pvt Ltd, Ambala, India) supplies it to schools, colleges and dealers.
Specifications
| Parameter | Detail |
|---|---|
| Chart topic | Petroleum and natural gas |
| Size (overall) | 58 x 90 cm (about 22.8 x 35.4 in) |
| Size when rolled | 58 x 4 x 2 cm |
| Paper | Coated art paper, 130 gsm |
| Printing | Full colour, offset printing using CTP (computer-to-plate) technology |
| Lamination | Both sides, thick plastic film (30 micron heat-sealable polyester) |
| Fittings | Plastic rollers, for wall hanging |
| Surface | Markable and washable |
| Weight | 228 g |
| Language | English only |
| Quality check | Each chart is visually inspected before dispatch |
| Pack quantity | Each (sold individually) |
| Minimum order quantity | 10 units |
| Dispatch time | Usually 7–10 working days |
| Product code | EL-GSC-2951 |
| Supplied by | Jain Laboratory Instruments Pvt Ltd (JLab), Ambala, India |
What Is the Petroleum and Natural Gas Chart Used For?
Petroleum and natural gas formed from tiny organisms that settled on ancient sea floors, were buried under layers of sediment and, over millions of years, were changed by heat and pressure in the absence of air. The oil and gas moved upward through porous rock until they were trapped beneath a layer of impermeable rock; wells are drilled to reach them, and natural gas is often found above the oil. In a refinery, crude oil is separated by fractional distillation: it is heated, the vapour rises through a tall column, and fractions with different boiling ranges condense at different heights — petroleum gas at the top, then petrol, kerosene and diesel, with lubricating oil, paraffin wax and bitumen among the heavier products.
Natural gas is mostly methane. Compressed as CNG it is a cleaner-burning fuel for buses and cars, and it is piped to homes and factories. Because petroleum products serve both as fuels and as raw materials for plastics, synthetic fibres, detergents and fertilisers, petroleum is often called black gold. The chart suits middle-school science on coal and petroleum (class 8 in the NCERT scheme), secondary chemistry on hydrocarbons and fuels, and geography lessons on energy resources; its markable, washable surface lets students write in the fractions during revision.
What to Specify When Ordering
- Quantity — the minimum order is 10 charts, each sold individually.
- Laboratory apparatus — a fractional distillation assembly lets students carry out the separation principle themselves.
- Companion chart — Fossil Fuels, from the same series, sets petroleum beside coal.
- Language — listed in English only; ask JLab for a larger image of the current print if you need to check the panels.
Frequently Asked Questions
What does the chart show?
The listing gives the title and print specification but does not itemise the panels. Ask JLab for a larger image of the current print if you need to confirm, for example, how the refinery column is drawn.
Is it suitable for chemistry as well as general science?
Yes. It supports chemistry lessons on hydrocarbons, fuels and fractional distillation as well as middle-school science and geography lessons on energy resources.
What is the chart printed on?
130 gsm coated art paper, offset printed in full colour with CTP technology and laminated on both sides with 30 micron heat-sealable polyester, so the surface is markable and washable.
How much does it weigh and how is it hung?
It weighs 228 g and hangs from plastic rollers; rolled, it measures 58 x 4 x 2 cm.
What should an export quotation request include?
The quantity, destination country and port or city, preferred delivery terms such as FOB or CIF, packing or labelling needs and, for tenders, the tender reference.
Who supplies the Petroleum and Natural Gas chart?
JLab (Jain Laboratory Instruments Pvt Ltd), Ambala, Haryana, supplies the chart and issues quotations directly.
Supplier
JLab is the trading name of Jain Laboratory Instruments Pvt Ltd, incorporated in 2017 and based on Hargolal Road, Ambala, Haryana. In addition to the laboratory glassware and school equipment it produces, JLab supplies printed teaching charts such as this one, so a chemistry department can order a distillation assembly and the wall chart that explains it together; every chart is visually inspected before it leaves. JLab exports worldwide and ships to buyers in every region — for example Nepal in South Asia, the Netherlands in Western Europe, Taiwan in East Asia, Tonga in Oceania and DR Congo in Central Africa. Tender buyers will find details on the JLab lab tenders page.
Petroleum, Fuels and Distillation
- Fossil Fuels — the series chart on coal, petroleum and natural gas together.
- Fractional Distillation Assembly — borosilicate glass apparatus with a Vigreux column for laboratory fractional distillation.
- Hydrocarbon Set — rock and oil samples showing how oil forms and how it is trapped underground.
- Energy Needs — the series chart on why we need energy.
- Carbon Cycle — what happens to the carbon in fuels after they are burned.
Browse the General Science Charts range or all Charts.
Request a Quote
Ask JLab for a direct quotation through the Add To Cart enquiry button on this page or the contact page, giving the quantity (minimum 10 units), any apparatus or other charts you need and the delivery location.
Last updated: 4 October 2026