Nuclear Energy Manufacturer,Supplier and Exporter in India
Product Code : EL-GSC-2953
Jlab Export is a leading Nuclear Energy Manufacturer,and suppliers in India
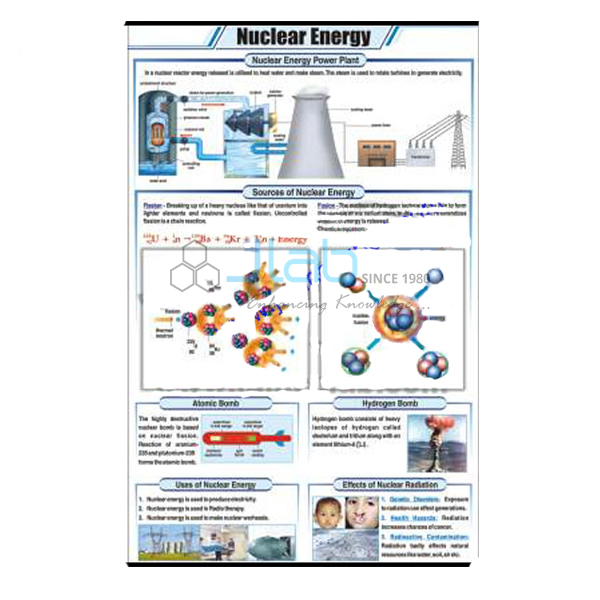
Nuclear Energy (code EL-GSC-2953) is a 58 x 90 cm wall chart on nuclear energy — the energy released when atomic nuclei split (fission) or join (fusion) — for physics, general science and energy-resources lessons. It is printed in full colour on coated art paper, laminated on both sides and fitted with plastic rollers. JLab (Jain Laboratory Instruments Pvt Ltd, Ambala, India) supplies it to schools, colleges and dealers.
Specifications
| Parameter | Detail |
|---|---|
| Chart topic | Nuclear energy |
| Size (overall) | 58 x 90 cm (about 22.8 x 35.4 in) |
| Size when rolled | 58 x 4 x 2 cm |
| Paper | Coated art paper, 130 gsm |
| Printing | Full colour, offset printing using CTP (computer-to-plate) technology |
| Lamination | Both sides, thick plastic film (30 micron heat-sealable polyester) |
| Fittings | Plastic rollers, for wall hanging |
| Surface | Markable and washable |
| Weight | 228 g |
| Language | English only |
| Quality check | Each chart is visually inspected before dispatch |
| Pack quantity | Each (sold individually) |
| Minimum order quantity | 10 units |
| Dispatch time | Usually 7–10 working days |
| Product code | EL-GSC-2953 |
| Supplied by | Jain Laboratory Instruments Pvt Ltd (JLab), Ambala, India |
What Is the Nuclear Energy Chart Used For?
In nuclear fission a heavy nucleus such as uranium absorbs a neutron and splits into two lighter nuclei, releasing a large amount of energy and further neutrons that can split more nuclei in a chain reaction. A nuclear power station keeps this chain reaction under control in a reactor, where a moderator slows the neutrons and control rods absorb them; the heat produced turns water into steam, which drives a turbine and generator. In nuclear fusion, light nuclei such as isotopes of hydrogen combine to form helium — the process that powers the Sun and other stars. In both cases a small loss of mass appears as energy, as Einstein’s relation E = mc² describes.
Nuclear power generates electricity without burning fuel, but it raises questions students enjoy debating: the safe handling and long-term storage of radioactive waste, the risk of accidents and the effects of radiation on living things. In India the topic comes up in secondary lessons on sources of energy and in the class 12 physics chapter on nuclei. The chart’s surface is listed as markable and washable, so students can trace the path from fission to electricity on it and the teacher can wipe it afterwards.
What to Specify When Ordering
- Quantity — the minimum order is 10 charts, each sold individually.
- Physics charts — Nuclear Reactor, Nuclear Fusion and Radioactivity are separate physics wall charts for more detailed senior-school study.
- Energy series — Energy Needs and Renewable Sources of Energy put nuclear power in context.
- Language — listed in English only; ask for a larger image of the current print if you need to check the panels.
Frequently Asked Questions
What does the Nuclear Energy chart explain?
Energy from the atomic nucleus, as its title says; the listing does not itemise the individual panels. Ask JLab for a larger image of the current print before ordering if you need to check a specific diagram.
Is it detailed enough for class 12 physics?
It works as an overview. For closer study, JLab also lists separate physics wall charts on the nuclear reactor, nuclear fusion and radioactivity, linked below.
What material is the chart?
130 gsm coated art paper, offset printed in full colour using CTP technology, laminated on both sides with 30 micron heat-sealable polyester; the surface is markable and washable.
What are its rolled size and weight?
It is 58 x 90 cm open, 58 x 4 x 2 cm when rolled on its plastic rollers, and weighs 228 g.
What do you need for an export quotation?
The quantity, destination country and port or city, preferred delivery terms such as FOB or CIF, any packing or labelling requirements and a tender reference where one applies.
Who supplies the Nuclear Energy chart?
JLab (Jain Laboratory Instruments Pvt Ltd), Ambala, Haryana, supplies it and quotes directly.
Supplier
JLab is the trading name of Jain Laboratory Instruments Pvt Ltd, incorporated in 2017 and based on Hargolal Road, Ambala, Haryana. It supplies printed physics and general science charts alongside the school laboratory equipment it produces, which lets a physics department fill its walls and its apparatus cupboard from one supplier; every chart is visually inspected before it is packed. JLab exports worldwide and ships to buyers in every region — for example Malaysia in Southeast Asia, Spain in Southern Europe, Iceland in Northern Europe, Panama in Central America and the Caribbean, and Afghanistan in South Asia. Institutions buying by tender can see the JLab lab tenders page.
Nuclear Physics and Energy Charts
- Nuclear Reactor — a laminated physics wall chart on how a reactor turns a controlled fission chain reaction into electricity.
- Nuclear Fusion — a physics wall chart on light nuclei joining and releasing energy.
- Radioactivity — a physics chart on unstable nuclei and alpha, beta and gamma radiation.
- Energy Needs — the series chart on why we need energy.
- Renewable Sources of Energy — the series chart on energy sources that nature replenishes.
Browse the General Science Charts range or all Charts.
Request a Quote
Quotations come directly from JLab. Use the Add To Cart enquiry button on this page or the contact page, and mention the quantity (minimum 10 units), any other physics charts you need and the delivery location.
Last updated: 4 October 2026