Renewable Sources of Energy Manufacturer,Supplier and Exporter in India
Product Code : EL-GSC-2952
Jlab Export is a leading Renewable Sources of Energy Manufacturer,and suppliers in India
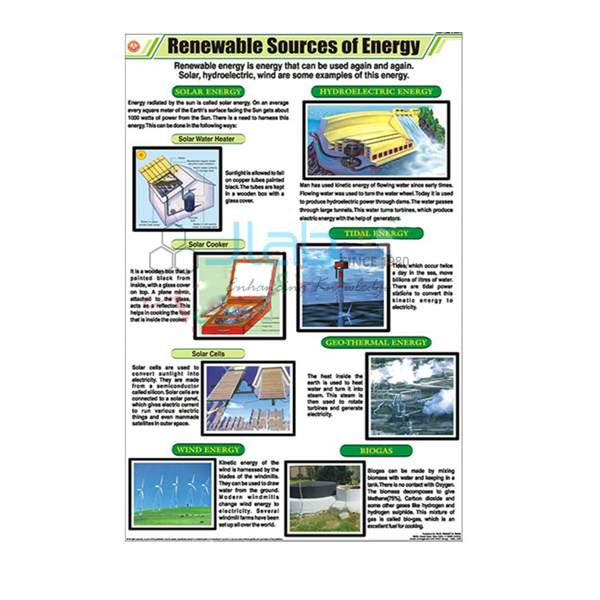
Renewable Sources of Energy (code EL-GSC-2952) is a 58 x 90 cm wall chart on renewable energy — sources such as sunlight, wind, flowing water and biomass that nature keeps replenishing — for science, geography and environmental studies lessons. It is printed in full colour on coated art paper, laminated on both sides and fitted with plastic rollers. JLab (Jain Laboratory Instruments Pvt Ltd, Ambala, India) supplies it to schools, colleges and dealers.
Specifications
| Parameter | Detail |
|---|---|
| Chart topic | Renewable sources of energy |
| Size (overall) | 58 x 90 cm (about 22.8 x 35.4 in) |
| Size when rolled | 58 x 4 x 2 cm |
| Paper | Coated art paper, 130 gsm |
| Printing | Full colour, offset printing using CTP (computer-to-plate) technology |
| Lamination | Both sides, thick plastic film (30 micron heat-sealable polyester) |
| Fittings | Plastic rollers, for wall hanging |
| Surface | Markable and washable |
| Weight | 228 g |
| Language | English only |
| Quality check | Each chart is visually inspected before dispatch |
| Pack quantity | Each (sold individually) |
| Minimum order quantity | 10 units |
| Dispatch time | Usually 7–10 working days |
| Product code | EL-GSC-2952 |
| Supplied by | Jain Laboratory Instruments Pvt Ltd (JLab), Ambala, India |
What Is the Renewable Sources of Energy Chart Used For?
A renewable source is one that nature replaces as fast as we use it, unlike coal or oil. Solar energy heats water in solar water heaters, cooks food in box-type solar cookers and produces electricity in solar cells; the wind turns turbines; flowing water drives hydroelectric generators; tides and the heat inside the Earth (geothermal energy) are tapped where conditions allow; and biomass, including biogas made from animal dung and plant waste, provides fuel in rural areas. Each source has limits — sunlight and wind vary with the weather and the seasons, and large dams flood land — and weighing these trade-offs is a common classroom exercise.
The chart supports middle-school lessons on sources of energy, secondary science and geography on conventional and non-conventional energy, and environmental studies projects on reducing fossil-fuel use. It works well beside working models such as a windmill, a hydro power model or a solar energy kit, so students see an energy conversion happen. The surface is listed as markable and washable, so a class can build a comparison table of the sources on it and wipe it clean afterwards.
What to Specify When Ordering
- Quantity — the minimum order is 10 charts, each sold individually.
- Companion charts — Solar Cooker and Bio-Gas, from the same series, give two renewable technologies a sheet each.
- Working models — add a windmill model, hydro power model or solar energy kit for demonstrations.
- Language — listed in English only; ask for a larger image of the current print if you need to check which sources are pictured.
Frequently Asked Questions
Which renewable sources does the chart include?
The listing does not itemise them. Solar, wind, hydro, tidal, geothermal and biomass energy are the sources usually taught; ask JLab for a larger image of the current print to confirm the coverage.
How does it differ from the Non Conventional Sources of Energy chart?
That is a separate title in a different print format; its own page lists wind, bio-energy, solar, geothermal and tidal energy. Compare the two listings, or ask JLab for images of both, before choosing.
What is it printed on?
130 gsm coated art paper, offset printed in full colour using CTP technology, with 30 micron heat-sealable polyester lamination on both sides.
How is it hung and stored?
It hangs from plastic rollers and rolls up to 58 x 4 x 2 cm; the chart weighs 228 g.
What should an export enquiry contain?
The quantity, the destination country and port or city, the delivery terms you need (for example FOB or CIF), packing or labelling instructions and any tender reference.
Who supplies the Renewable Sources of Energy chart?
JLab (Jain Laboratory Instruments Pvt Ltd) of Ambala, Haryana, supplies it and quotes directly.
Supplier
JLab is the trading name of Jain Laboratory Instruments Pvt Ltd, incorporated in 2017 and based on Hargolal Road, Ambala, Haryana. JLab supplies printed charts from this general science series together with the physics and school laboratory equipment it produces, so energy charts and working models can arrive in the same shipment; each chart is visually inspected before packing. The company is registered under CIN U29309HR2017PTC069123 and GSTIN 06AADCJ9848D1ZE. JLab exports worldwide and ships to buyers in every region — for example Singapore in Southeast Asia, Benin in West Africa, Egypt in North Africa, Japan in East Asia and the Czech Republic in Eastern Europe. Tender details are on the JLab lab tenders page.
Renewable Energy Charts and Models
- Solar Cooker — the series chart on cooking with sunlight.
- Bio-Gas — the series chart on making fuel gas from organic waste.
- Non Conventional Sources of Energy — a separate wall chart on wind, bio-energy, solar, geothermal and tidal energy.
- Windmill Model — demonstrates electricity generation from wind power.
- Hydro Power Model — a demonstration model of generating electricity from water.
- Solar Energy Kit — a solar panel spins a fan to drive small model boats or cars.
Browse the General Science Charts range or all Charts.
Request a Quote
JLab sends quotations directly. Use the Add To Cart enquiry button on this page, or send the quantity (minimum 10 units), any models or other charts and the delivery location through the contact page.
Last updated: 4 October 2026