Water Pollution Chart Manufacturer,Supplier and Exporter in India
Product Code : EL-MAE-3153
Jlab Export is a leading Water Pollution Chart Manufacturer,and suppliers in India
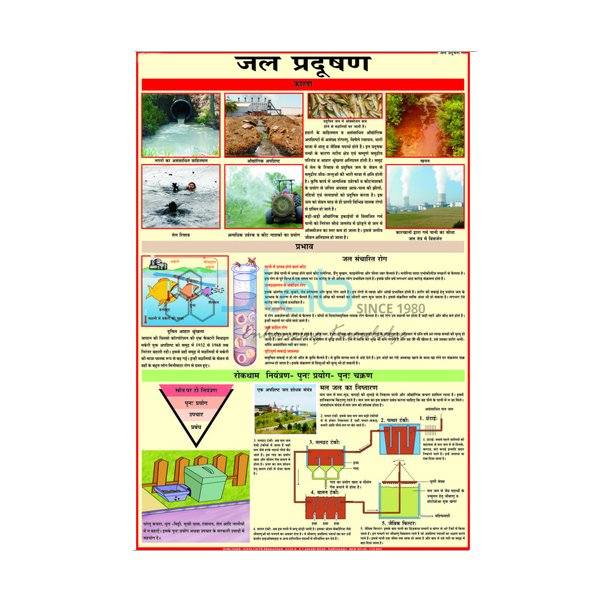
Water Pollution Chart (code EL-MAE-3153) is a 50 x 75 cm wall chart that shows industrial effluents mixing with river water and the problem of providing safe drinking water, for school lessons on water pollution and environmental studies. It is printed in natural colours on 80 gsm map litho paper, laminated on both sides and fitted with plastic rollers, in English, Hindi or Marathi. JLab (Jain Laboratory Instruments Pvt Ltd, Ambala, India) supplies it to schools, colleges and dealers.
Specifications
| Parameter | Detail |
|---|---|
| Topics shown | Industrial effluents mixing with river water; the failure to provide safe drinking water |
| Size | 50 x 75 cm |
| Printing | Multicolour, in natural colours, on 80 gsm map litho paper |
| Lamination | Hot-seal polyester film on both sides |
| Hanging | Plastic rollers at top and bottom |
| Language editions | English, Hindi or Marathi (separate charts) |
| Quality check | Each chart is visually inspected before dispatch |
| Pack quantity | Each (sold individually) |
| Minimum order quantity | 10 units |
| Dispatch time | Usually 7–10 working days |
| Product code | EL-MAE-3153 |
| Supplied by | Jain Laboratory Instruments Pvt Ltd (JLab), Ambala, India |
What Is the Water Pollution Chart Used For?
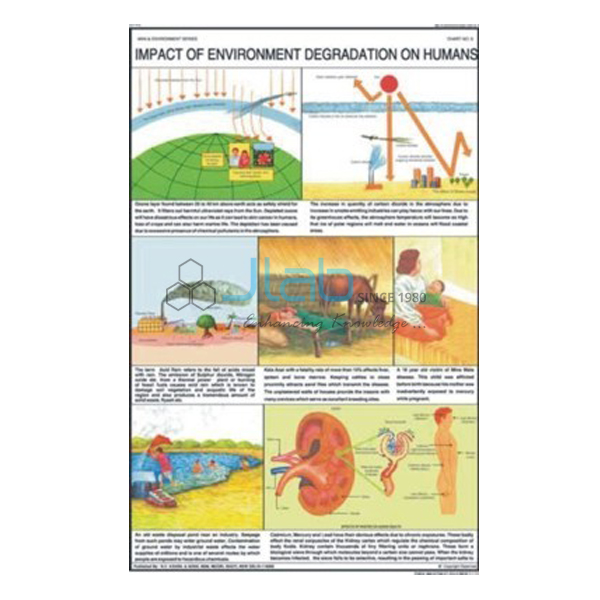
The chart follows polluted water from its source to the tap. Effluents are the waste water that industries discharge, and when they reach a river untreated they can carry harmful chemicals downstream to the towns and villages that draw their water from it. Lessons usually add the other main sources — sewage, garbage, and run-off from fields carrying fertilisers and pesticides — and explain why contaminated water spreads water-borne diseases such as cholera, typhoid and diarrhoea.
The second theme is safe drinking water: what happens when it is not provided, and how water can be made safer by filtering, boiling or chlorination, and how treating waste water before it is released protects rivers in the first place. The chart is used in environmental studies, middle-school science and geography lessons on water resources; it pairs naturally with a water cycle chart.
What to Specify When Ordering
- Language edition — English, Hindi or Marathi.
- Quantity — minimum 10 units, sold individually.
- Companion items — the water cycle chart or the air and water pollution 3D model for a fuller display.
Frequently Asked Questions
What does the Water Pollution Chart show?
Industrial effluents mixing with river water and the problem of providing safe drinking water, as described in its listing.
What are industrial effluents?
They are the liquid wastes that factories and other industrial units discharge. Untreated effluents can carry chemicals that harm river life and make the water unsafe to drink.
What size is the chart and how is it finished?
It is 50 x 75 cm, printed in multicolour on 80 gsm map litho paper, laminated with hot-seal polyester film on both sides, with plastic rollers at top and bottom.
Which language editions can be ordered?
English, Hindi or Marathi, each as a separate chart. The product photo may show one particular edition, so confirm the language you need.
Who supplies this chart?
JLab, the trading name of Jain Laboratory Instruments Pvt Ltd of Ambala, Haryana, India, supplies the chart and quotes directly.
Supplier
JLab is the trading name of Jain Laboratory Instruments Pvt Ltd, a teaching and laboratory equipment company incorporated in 2017 and based on Hargolal Road, Ambala, Haryana. JLab supplies environment charts such as this one alongside the equipment in its own range, which lets schools and dealers order charts, models and lab items in one go, and each chart is looked over before dispatch. JLab exports worldwide and ships to buyers in every region — Belize in Central America and the Caribbean, Angola in Central Africa, Poland in Eastern Europe, Kazakhstan in Central Asia and Lesotho in Southern Africa, to name a few. For tender purchases, see the JLab lab tenders page.
Related Water and Pollution Items
- Water Cycle In Nature Chart — how water keeps moving between the sea, the air and the land.
- Air and Water Pollution 3D Model — a rigid PVC relief model of the factors that pollute air and water.
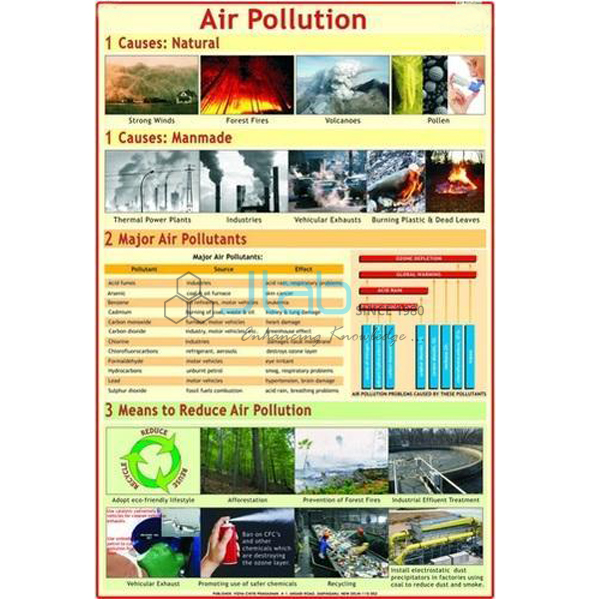
- Air Pollution Chart — pollutants and the lungs, ozone-layer thinning and the greenhouse effect.
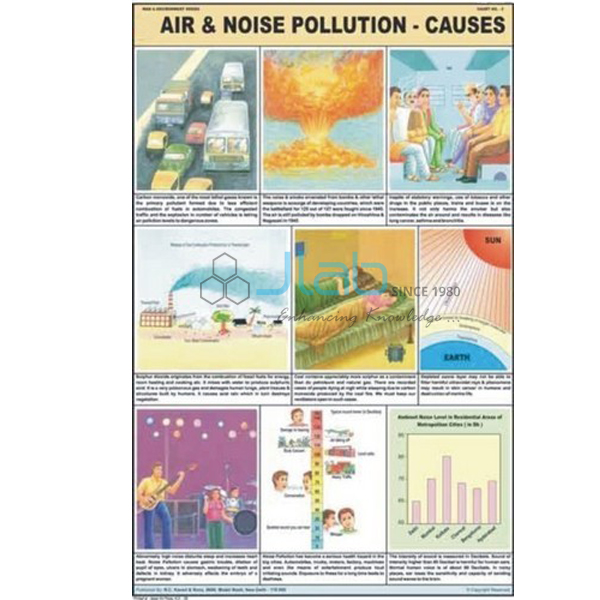
- Air and Noise Pollution Chart — air and noise pollution on one chart from the same series.
- Flora and Fauna Chart — how careless use of natural resources makes valuable species disappear.
More titles are in the Man and Environment series and the wider Charts range.
Request a Quote
JLab quotes directly. Use the Add To Cart enquiry button or the contact page to send the language edition, the quantity (minimum 10 units) and your delivery destination.
Last updated: 4 October 2026