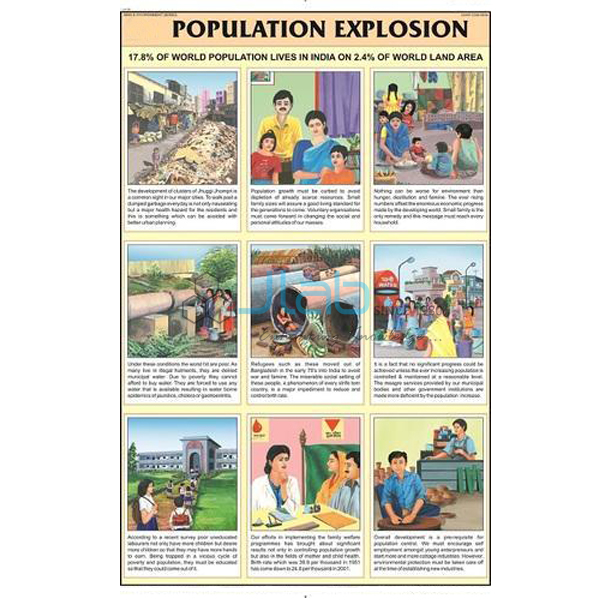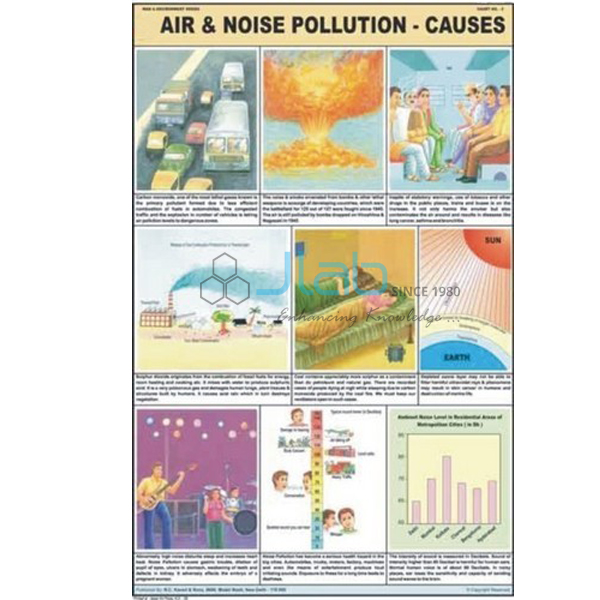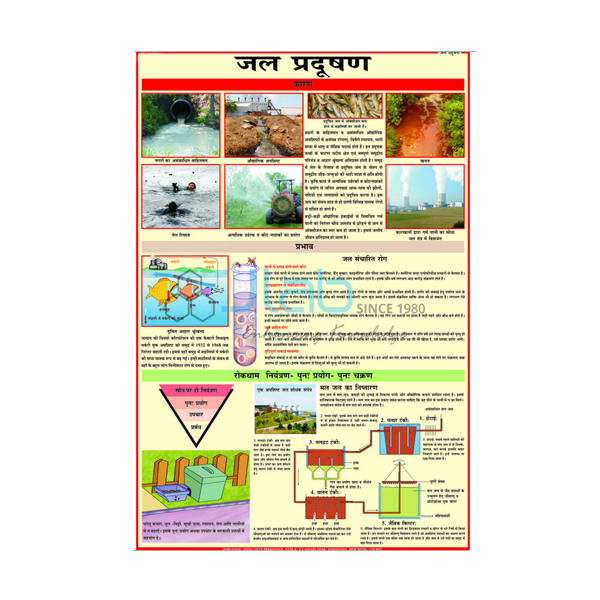

Impact of Environment Degradation on Humans Chart Manufacturer,Supplier and Exporter in India
Product Code : EL-MAE-3157
Jlab Export is a leading Impact of Environment Degradation on Humans Chart Manufacturer,and suppliers in India
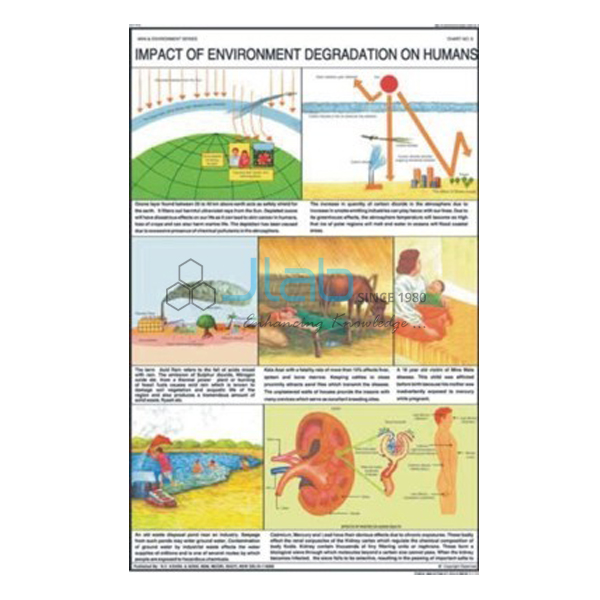
Impact of Environment Degradation on Humans Chart (code EL-MAE-3157) is a 50 x 75 cm wall chart that explains how the ozone layer protects us and the greenhouse effect of carbon dioxide (CO2), for science and environmental studies classes. It is printed in natural colours on 80 gsm map litho paper, laminated on both sides with plastic rollers, in English, Hindi or Marathi. JLab (Jain Laboratory Instruments Pvt Ltd, Ambala, India) supplies it to schools, colleges and dealers.
Get a quote: use the Add To Cart enquiry button below, or send your quantity and destination through the contact page.
Specifications
| Parameter | Detail |
|---|---|
| Topics explained | How the ozone layer protects us; the greenhouse effect of CO2 |
| Size | 50 x 75 cm |
| Printing | Multicolour, in natural colours, on 80 gsm map litho paper |
| Lamination | Hot-seal polyester film on both sides |
| Hanging | Plastic rollers at top and bottom |
| Language editions | English, Hindi or Marathi (separate charts) |
| Quality check | Each chart is visually inspected before dispatch |
| Pack quantity | Each (sold individually) |
| Minimum order quantity | 10 units |
| Dispatch time | Usually 7–10 working days |
| Product code | EL-MAE-3157 |
| Supplied by | Jain Laboratory Instruments Pvt Ltd (JLab), Ambala, India |
What Is the Environment Degradation Chart Used For?
This chart brings two global problems down to their effect on people. The ozone layer, high in the atmosphere, absorbs most of the Sun’s ultraviolet radiation; where it has been thinned by chlorofluorocarbons and similar chemicals, more ultraviolet light reaches the ground, raising the risk of sunburn, skin cancer and eye cataracts and harming crops and ocean life. The greenhouse effect is the trapping of heat by carbon dioxide and other gases: sunlight passes through the air, but part of the heat the Earth gives off is held back.
A natural greenhouse effect keeps the planet habitable, but the extra carbon dioxide released by burning coal, oil and gas and by cutting forests strengthens it, leading to global warming, melting ice, rising sea levels and changing rainfall. Classes then discuss the remedies — cleaner and renewable energy, saving energy, planting trees and phasing out ozone-depleting chemicals. The chart suits middle and secondary school science, geography and environmental studies.
What to Specify When Ordering
- Language edition — English, Hindi or Marathi.
- Quantity — minimum 10 units, sold individually.
- Companion charts — the air pollution and energy charts of the same series carry the topic further.
Frequently Asked Questions
What does the Impact of Environment Degradation on Humans Chart explain?
According to its listing, it explains how the ozone layer protects us and the greenhouse effect of carbon dioxide (CO2).
How does the ozone layer protect us?
It absorbs most of the Sun’s harmful ultraviolet radiation before it reaches the ground, reducing the risk of sunburn, skin cancer and cataracts.
How is this chart different from the Air Pollution Chart?
Both cover the ozone layer and the greenhouse effect, but the Air Pollution Chart also shows how pollutants affect the human lungs, while this title concentrates on ozone protection and the greenhouse effect of carbon dioxide.
What size is the chart and how does it hang?
It is 50 x 75 cm, printed in multicolour on 80 gsm map litho paper, laminated with hot-seal polyester film on both sides and fitted with plastic rollers at top and bottom.
What are the minimum order and dispatch time?
10 units minimum, sold individually. Each chart is visually inspected and dispatch is usually within 7–10 working days; export transit is extra.
Who supplies this chart?
JLab, the trading name of Jain Laboratory Instruments Pvt Ltd in Ambala, Haryana, India, supplies it and quotes directly.
Supplier
JLab is the trading name of Jain Laboratory Instruments Pvt Ltd, a teaching and laboratory equipment company incorporated in 2017 on Hargolal Road, Ambala, Haryana. JLab supplies environment charts such as this one together with the equipment of its own range, so that schools and dealers can bring their charts and lab items into one order, and every chart gets a visual check before it is packed. JLab exports worldwide and ships to buyers in every region — for example Uzbekistan in Central Asia, Gambia in West Africa, Brunei in Southeast Asia, South Korea in East Asia and Belgium in Western Europe. Tender buyers can refer to the JLab lab tenders page.
Related Environment Charts
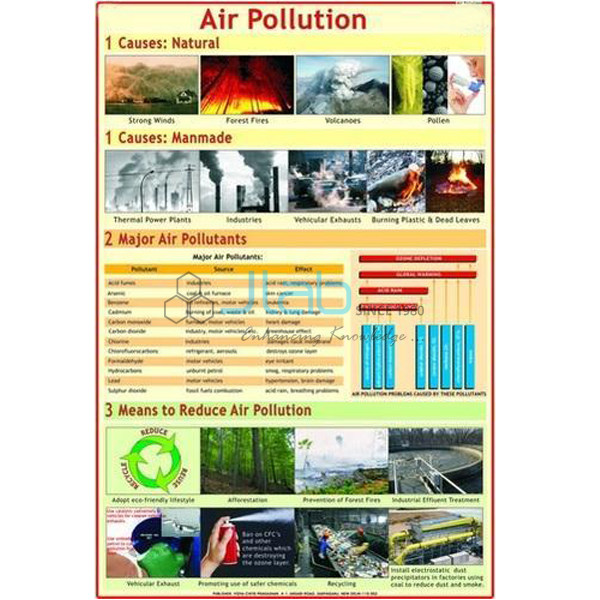
- Air Pollution Chart — pollutants and the lungs, ozone-layer thinning and the greenhouse effect.
- Air and Noise Pollution Chart — air and noise pollution together on one chart.
- Non Conventional Sources of Energy — wind, bio-, solar, geothermal and tidal energy.
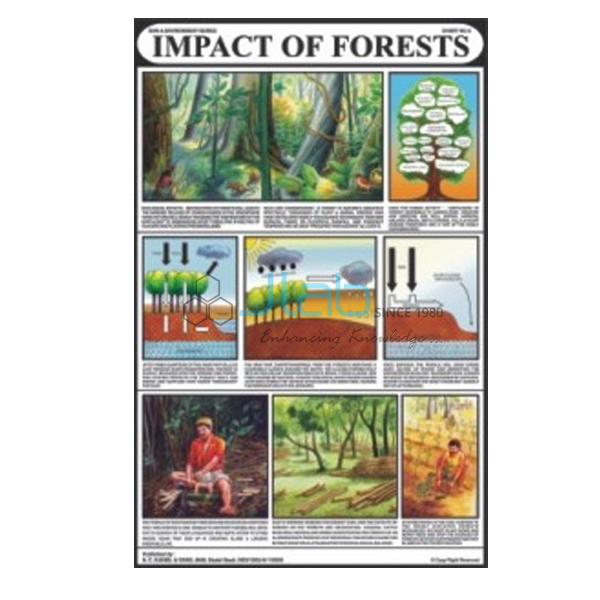
- Impacts of Forests Chart — how destroying forests sets off a vicious circle of loss of flora and fauna.
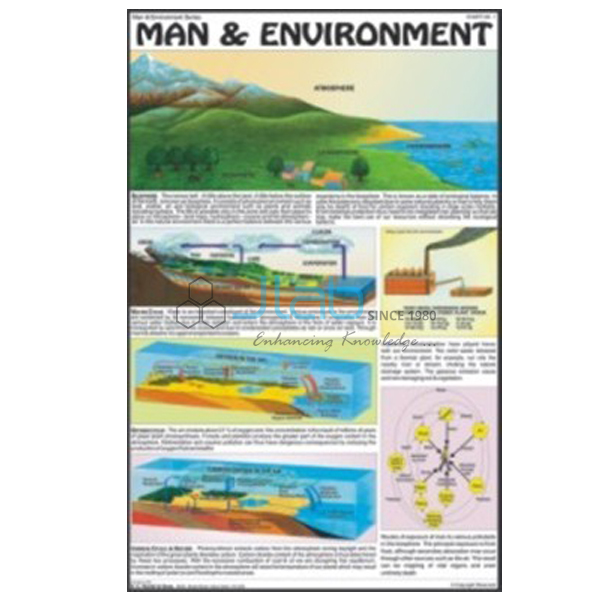
- Man and Environment Chart — how people live in, use and change their surroundings.
See the other titles in Man and Environment and the full Charts range.
Request a Quote
JLab quotes directly. Send the edition, the quantity (minimum 10 units) and the delivery destination through the Add To Cart enquiry button or the contact page.
Last updated: 4 October 2026