Population Explosion Chart Manufacturer,Supplier and Exporter in India
Product Code : EL-MAE-3156
Jlab Export is a leading Population Explosion Chart Manufacturer,and suppliers in India
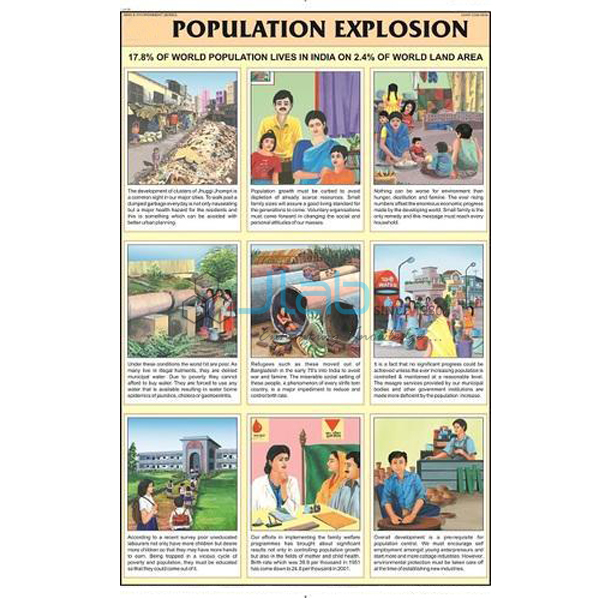
Population Explosion Chart (code EL-MAE-3156) is a 50 x 75 cm wall chart that shows the link between poverty and population, for social science, geography and environmental studies classes. Printed in natural colours on 80 gsm map litho paper, it is laminated on both sides, hangs from plastic rollers and is available in English, Hindi or Marathi. JLab (Jain Laboratory Instruments Pvt Ltd, Ambala, India) supplies it to schools, colleges and dealers.
Specifications
| Parameter | Detail |
|---|---|
| Theme | The link between poverty and population |
| Size | 50 x 75 cm |
| Printing | Multicolour, in natural colours, on 80 gsm map litho paper |
| Lamination | Hot-seal polyester film on both sides |
| Hanging | Plastic rollers at top and bottom |
| Language editions | English, Hindi or Marathi (separate charts) |
| Illustrations | Not itemised in the listing; ask JLab for a preview image |
| Quality check | Each chart is visually inspected before dispatch |
| Pack quantity | Each (sold individually) |
| Minimum order quantity | 10 units |
| Dispatch time | Usually 7–10 working days |
| Product code | EL-MAE-3156 |
| Supplied by | Jain Laboratory Instruments Pvt Ltd (JLab), Ambala, India |
What Is the Population Explosion Chart Used For?
A population explosion is a period of very fast growth, which happens when better health care, food supply and sanitation bring the death rate down while the birth rate stays high. The chart’s theme is how this growth and poverty feed each other. In many poor households children are expected to help with work and to support their parents in old age, while high child mortality, little schooling — especially for girls — and weak access to health care keep birth rates up. At the same time, a fast-growing population stretches land, water, jobs, schools, housing and health services, which makes poverty harder to escape.
Lessons usually end with what slows growth: education, particularly of girls, better health care and family welfare services. In NCERT social science the ideas appear in the class 8 geography chapter on human resources, which explains birth rate, death rate and migration, and in the class 9 economics chapter on poverty. The chart is equally useful in environmental studies, where population pressure links to forests, water and energy.
What to Specify When Ordering
- Language edition — English, Hindi or Marathi.
- Quantity — minimum 10 units, sold individually.
- Preview — ask for an image if the chart has to match a particular syllabus.
- Series titles — the forest, water and environment charts from the same series show the pressures of a growing population.
Frequently Asked Questions
What does the Population Explosion Chart show?
Its listing describes it as showing the link between poverty and population.
What is a population explosion?
A period of very rapid population growth, typically when death rates fall because of better health care and food supply while birth rates remain high.
What size is the chart and how is it finished?
It is 50 x 75 cm, printed in multicolour on 80 gsm map litho paper, laminated with hot-seal polyester film on both sides and fitted with plastic rollers at top and bottom.
Which language editions are available?
English, Hindi and Marathi, as separate charts.
Who supplies this chart?
JLab, the trading name of Jain Laboratory Instruments Pvt Ltd of Ambala, Haryana, India, supplies the chart and quotes directly.
Supplier
JLab is the trading name of Jain Laboratory Instruments Pvt Ltd, incorporated in 2017 and based on Hargolal Road, Ambala, Haryana. Alongside the teaching and laboratory equipment in its own range, JLab supplies social science and environment charts like this one, so a school or dealer can bring charts and lab items together in one order, and every chart is checked by eye before dispatch. The company is registered under CIN U29309HR2017PTC069123 and GSTIN 06AADCJ9848D1ZE. JLab exports worldwide and ships to buyers in every region — for example Uzbekistan in Central Asia, Germany in Western Europe, Colombia in South America, the USA in North America and Samoa in Oceania. Tender information is on the JLab lab tenders page.
Related Charts
- Man and Environment Chart — how people live in, use and change their surroundings.
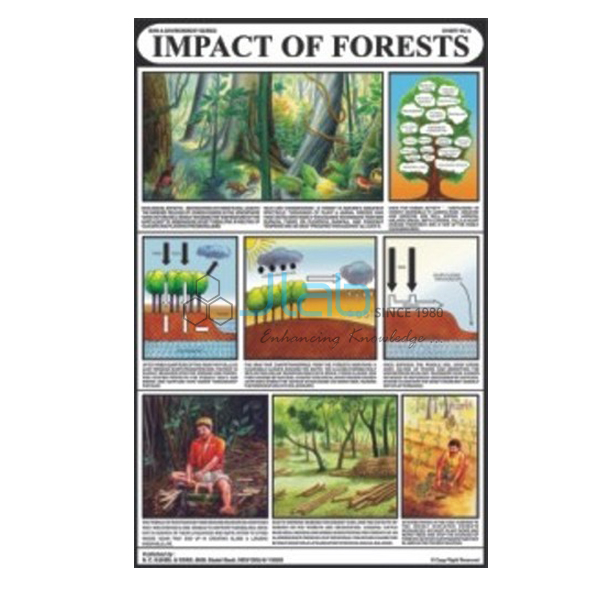
- Impacts of Forests Chart — how destroying forests sets off a vicious circle of loss of flora and fauna.
- Water Pollution Chart — industrial effluents entering river water and safe drinking water.
- Flora and Fauna Chart — how careless use of natural resources makes valuable species disappear.
- Energy Needs — why we need energy and the forms in which we use it.
More titles are in the Man and Environment series and the wider Charts range.
Request a Quote
Quotations come directly from JLab. Send the edition, the quantity (minimum 10 units) and the delivery destination using the Add To Cart enquiry button or the contact page.
Last updated: 4 October 2026