Impacts of Forests Chart Manufacturer,Supplier and Exporter in India
Product Code : EL-MAE-3154
Jlab Export is a leading Impacts of Forests Chart Manufacturer,and suppliers in India
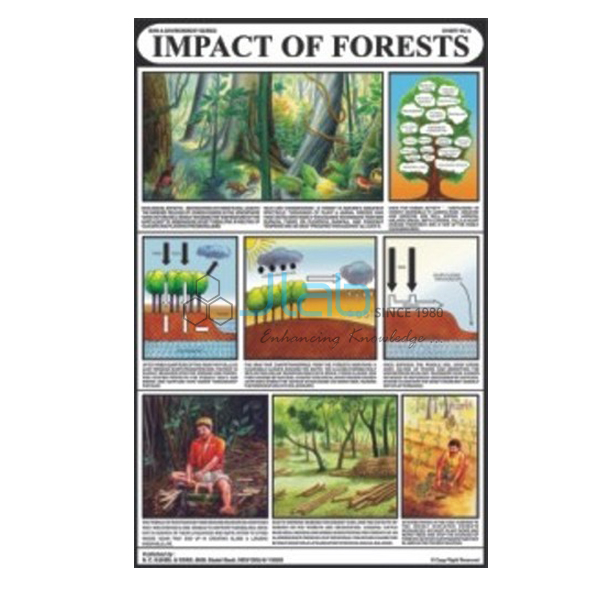
Impacts of Forests Chart (code EL-MAE-3154) is a 50 x 75 cm classroom chart on how the indiscriminate destruction of forest reserves sets off a vicious circle of destruction of flora and fauna, used in environmental studies, geography and biology lessons. Printed in natural colours on 80 gsm map litho paper, it is laminated, hangs from plastic rollers and comes in English, Hindi or Marathi. JLab (Jain Laboratory Instruments Pvt Ltd, Ambala, India) supplies it to schools, colleges and dealers.
Specifications
| Parameter | Detail |
|---|---|
| Theme | Indiscriminate destruction of forest reserves and the vicious circle of destruction of flora and fauna that follows |
| Size | 50 x 75 cm |
| Printing | Multicolour, in natural colours, on 80 gsm map litho paper |
| Lamination | Hot-seal polyester film on both sides |
| Hanging | Plastic rollers at top and bottom |
| Language editions | English, Hindi or Marathi (separate charts) |
| Quality check | Each chart is visually inspected before dispatch |
| Pack quantity | Each (sold individually) |
| Minimum order quantity | 10 units |
| Dispatch time | Usually 7–10 working days |
| Product code | EL-MAE-3154 |
| Supplied by | Jain Laboratory Instruments Pvt Ltd (JLab), Ambala, India |
What Is the Impacts of Forests Chart Used For?
Forests do far more than supply timber. They shelter a large share of the world’s land plants and animals, their roots hold the soil in place, the water vapour released by trees helps bring rain, and they take up carbon dioxide from the air. The chart’s point is what happens when forest reserves are cut down without restraint: wildlife loses its home, bare soil washes away, rainfall and water supply suffer, and the damaged land supports even less plant and animal life — a vicious circle that is hard to reverse.
Teachers use it to discuss why forests are cleared — for farmland, timber, mining, roads and settlements — and what can be done: afforestation and reforestation, protected forests, and people’s movements such as Chipko, in which villagers hugged trees to stop them being felled. The topic fits environmental studies, middle-school science lessons on the conservation of forests and wildlife, and geography lessons on natural vegetation.
What to Specify When Ordering
- Language edition — English, Hindi or Marathi.
- Quantity — minimum order 10 units, sold individually.
- Linked titles — the flora and fauna and soil conservation charts follow on directly from this one.
Frequently Asked Questions
What does the Impacts of Forests Chart show?
How indiscriminate destruction of forest reserves leads to a vicious circle of destruction of plants and animals, as described in its listing.
What is meant by a vicious circle here?
Each loss makes the next one worse: cutting forests destroys habitats and exposes the soil, erosion and drier conditions make it harder for vegetation to recover, and the poorer land supports fewer plants and animals still.
What size is the chart and what is it printed on?
50 x 75 cm, printed in multicolour on 80 gsm map litho paper, laminated with hot-seal polyester film on both sides and fitted with plastic rollers.
Which languages are available?
Separate editions in English, Hindi and Marathi. State the edition when you enquire.
Who supplies this chart?
JLab (Jain Laboratory Instruments Pvt Ltd) of Ambala, Haryana, India supplies it and quotes directly.
Supplier
JLab is the trading name of Jain Laboratory Instruments Pvt Ltd, incorporated in 2017 and based on Hargolal Road, Ambala, Haryana. Next to the laboratory and teaching equipment of its own range, JLab supplies environmental studies charts like this one, so a school or dealer can cover charts and lab items in one order; each chart is visually checked before it is dispatched. JLab exports worldwide and ships to buyers in every region — for example Belize in Central America and the Caribbean, Oman in the Middle East, Tunisia in North Africa, Malta in Southern Europe and the Netherlands in Western Europe. Tender details are on the JLab lab tenders page.
Related Man and Environment Charts
- Flora and Fauna Chart — how careless use of natural resources makes valuable species disappear.
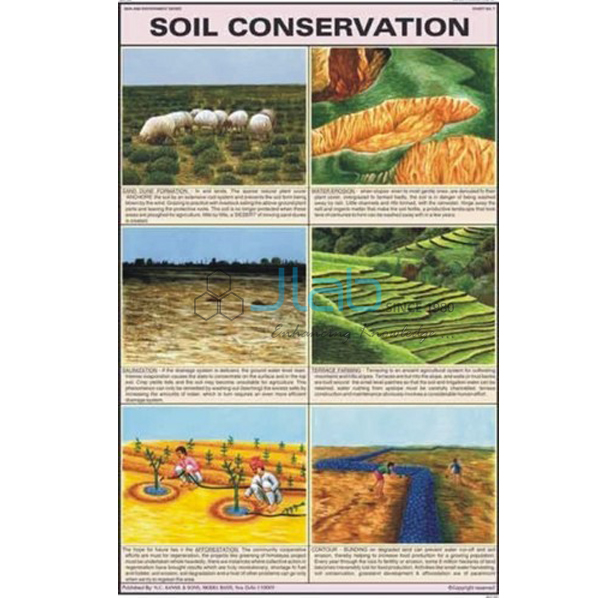
- Soil Conservation Chart — protecting the soil that forests help to hold.
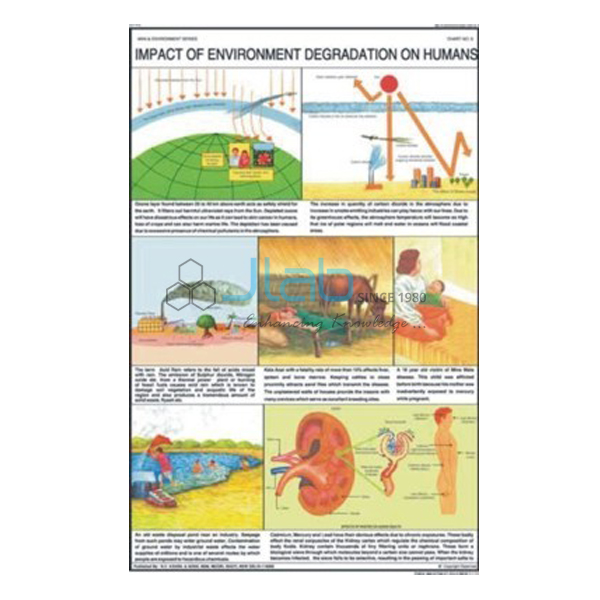
- Impact of Environment Degradation on Humans Chart — the ozone layer and the greenhouse effect of carbon dioxide.
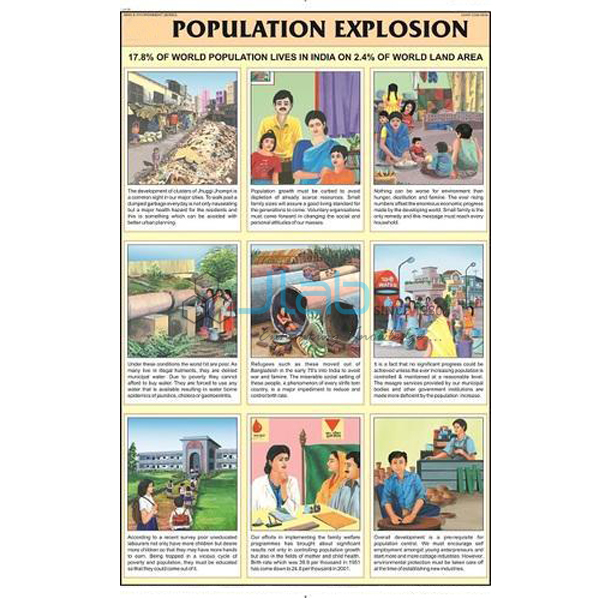
- Population Explosion Chart — the link between poverty and population.
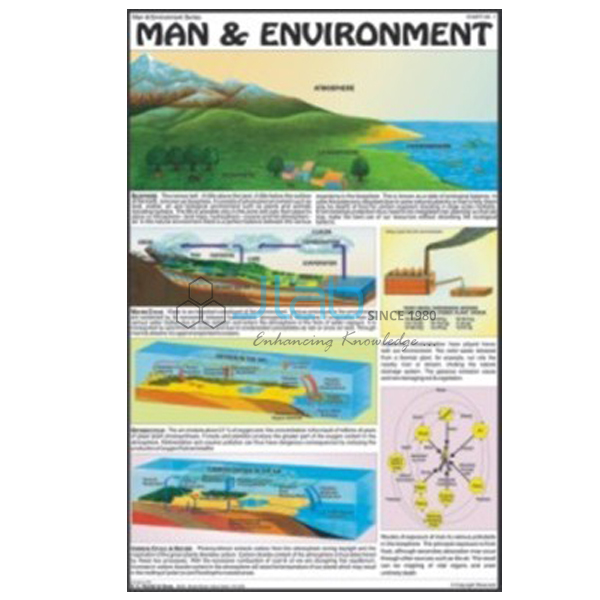
- Man and Environment Chart — how people live in, use and change their surroundings.
Browse the full Man and Environment series or all Charts.
Request a Quote
Quotations come directly from JLab. Send the edition, the quantity (minimum 10 units) and the delivery destination through the Add To Cart enquiry button or the contact page.
Last updated: 4 October 2026