Man and Environment Chart Manufacturer,Supplier and Exporter in India
Product Code : EL-MAE-3149
Jlab Export is a leading Man and Environment Chart Manufacturer,and suppliers in India
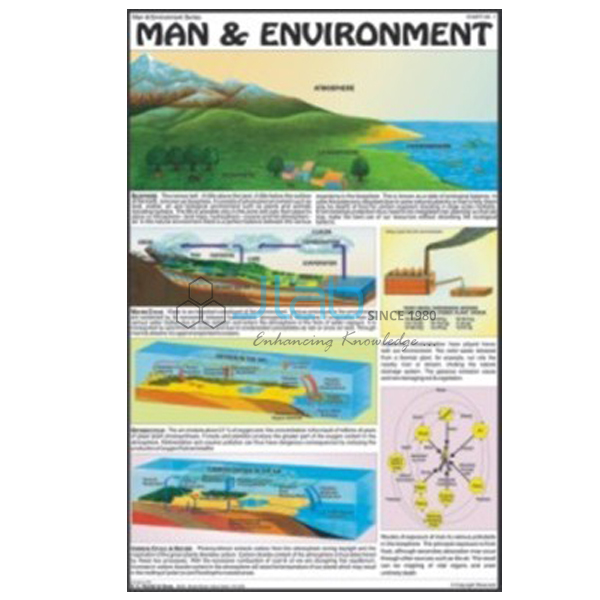
Man and Environment Chart (code EL-MAE-3149) is a 50 x 75 cm classroom wall chart on how people live in, use and change their surroundings, for environmental studies and geography lessons in schools. It is printed in natural colours on 80 gsm map litho paper, laminated on both sides and hung from plastic rollers, in separate English, Hindi or Marathi editions. JLab (Jain Laboratory Instruments Pvt Ltd, Ambala, India) supplies it to schools, colleges and dealers.
Specifications
| Parameter | Detail |
|---|---|
| Subject | Man and environment |
| Size | 50 x 75 cm |
| Printing | Multicolour, in natural colours, on 80 gsm map litho paper |
| Lamination | Hot-seal polyester film on both sides |
| Hanging | Plastic rollers at top and bottom |
| Language editions | English, Hindi or Marathi (separate charts) |
| Chart content | Not itemised in the listing; ask JLab for a preview image |
| Quality check | Each chart is visually inspected before dispatch |
| Pack quantity | Each (sold individually) |
| Minimum order quantity | 10 units |
| Dispatch time | Usually 7–10 working days |
| Product code | EL-MAE-3149 |
| Supplied by | Jain Laboratory Instruments Pvt Ltd (JLab), Ambala, India |
What Is the Man and Environment Chart Used For?
The chart shares its name with the Man and Environment series it belongs to. Lessons on the environment usually start by separating the natural environment — land, water, air and living things — from the human-made environment of houses, roads, farms and industries, and then ask how the two affect each other. In NCERT geography the class 7 book opens with exactly this topic, and environmental studies classes come back to it whenever they discuss forests, pollution or the use of resources.
It can hang on its own or beside the topic charts on air, water, forests, soil, population and energy from the same series. Because the separate editions are in English, Hindi and Marathi, state the language you need; ask for a preview image if the illustrations have to match your textbook.
What to Specify When Ordering
- Language edition — English, Hindi or Marathi.
- Quantity — minimum 10 units, sold individually.
- Other titles in the series — list them on the same enquiry if you are building a full environment display.
Frequently Asked Questions
What size is the Man and Environment Chart and what is it printed on?
It is 50 x 75 cm, printed in multicolour on 80 gsm map litho paper.
Which languages is it available in?
English, Hindi and Marathi, each as a separate edition. Mention the edition in your enquiry.
How is the chart finished for classroom use?
It is laminated with hot-seal polyester film on both sides and fitted with plastic rollers at the top and bottom for hanging.
What is the difference between the natural and the human-made environment?
The natural environment is the land, water, air and living things around us; the human-made environment is what people have added, such as buildings, roads, farms and factories.
Who supplies this chart?
JLab (Jain Laboratory Instruments Pvt Ltd), based in Ambala, Haryana, India, supplies it and quotes directly to schools, colleges and dealers.
Supplier
JLab is the trading name of Jain Laboratory Instruments Pvt Ltd, incorporated in 2017 and based on Hargolal Road, Ambala, Haryana. It resells environmental studies charts such as this series alongside the laboratory and teaching equipment in its own range, so one order can cover a school’s charts and lab items, and it inspects every chart by eye before packing. JLab exports worldwide and ships to buyers in every region — for example Turkey in the Middle East, Japan in East Asia, Vietnam in Southeast Asia, Mali in West Africa and Mexico in North America. For tenders, see the JLab lab tenders page.
Other Man and Environment Charts
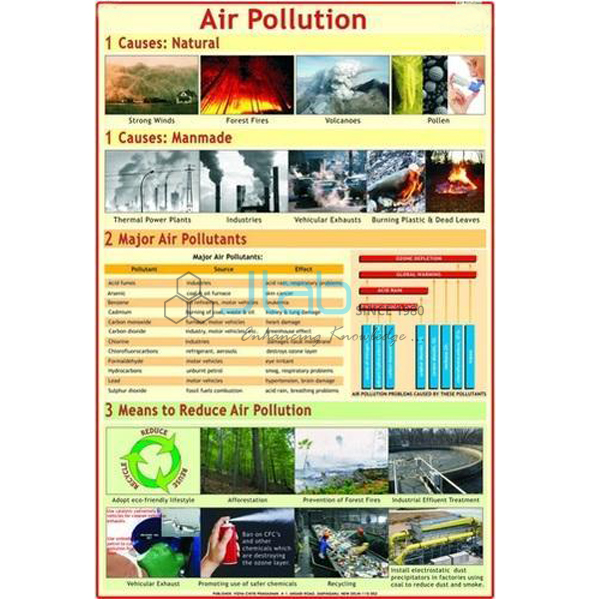
- Air Pollution Chart — how pollutants affect the lungs, thinning of the ozone layer and the greenhouse effect.
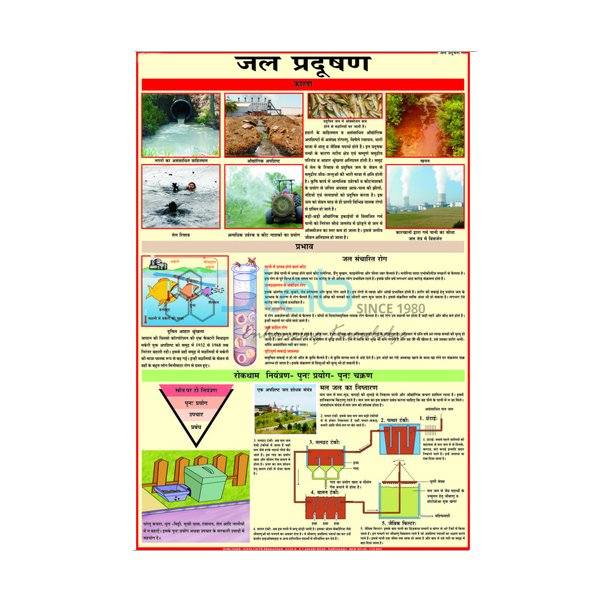
- Water Pollution Chart — industrial effluents entering river water and the problem of safe drinking water.
- Flora and Fauna Chart — how indiscriminate use of natural resources makes valuable species disappear.
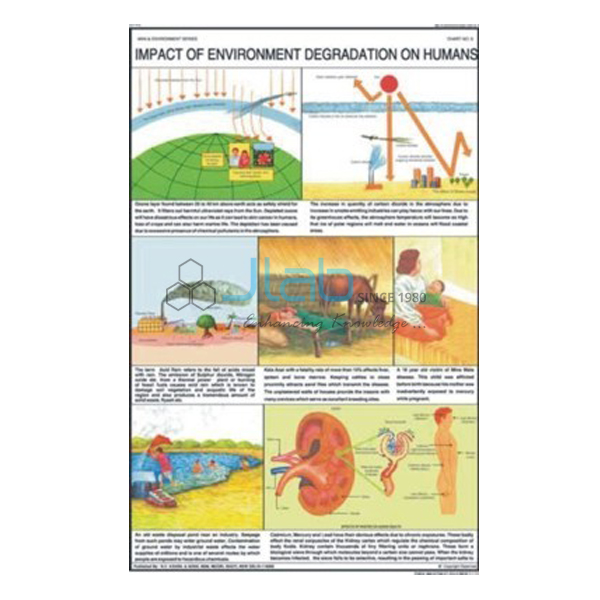
- Impact of Environment Degradation on Humans Chart — how the ozone layer protects us and the greenhouse effect of carbon dioxide.
- Non Conventional Sources of Energy — wind, bio-, solar, geothermal and tidal energy.
- Air and Water Pollution 3D Model — a rigid PVC relief model of the factors that pollute air and water.
Browse the full Man and Environment series or all Charts.
Request a Quote
JLab quotes directly. Send the language edition, the quantity (minimum 10 units) and the delivery location through the Add To Cart enquiry button or the contact page, together with any other titles from the series.
Last updated: 4 October 2026