August Map Manufacturer,Supplier and Exporter in India
Product Code : EL-WMOI-3168
Jlab Export is a leading August Map Manufacturer,and suppliers in India
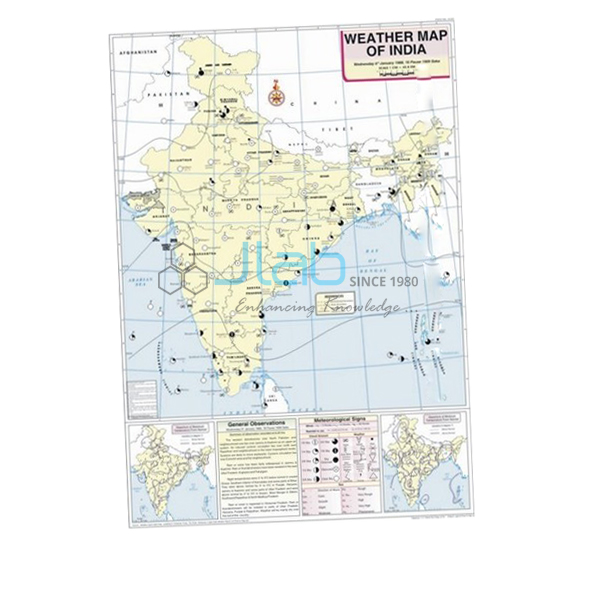
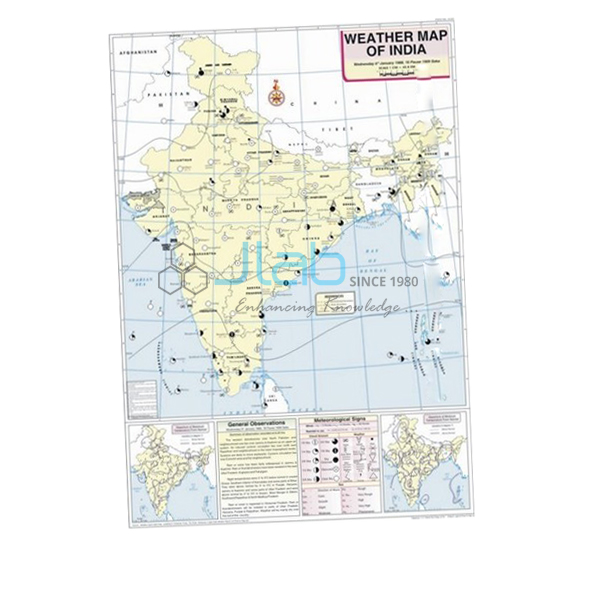
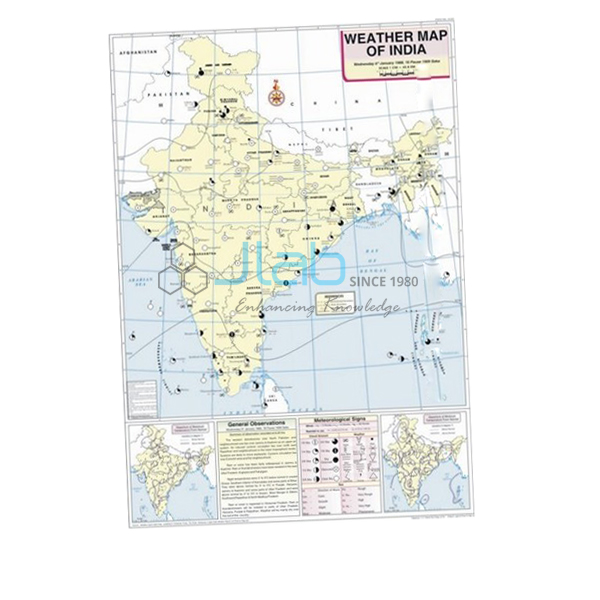
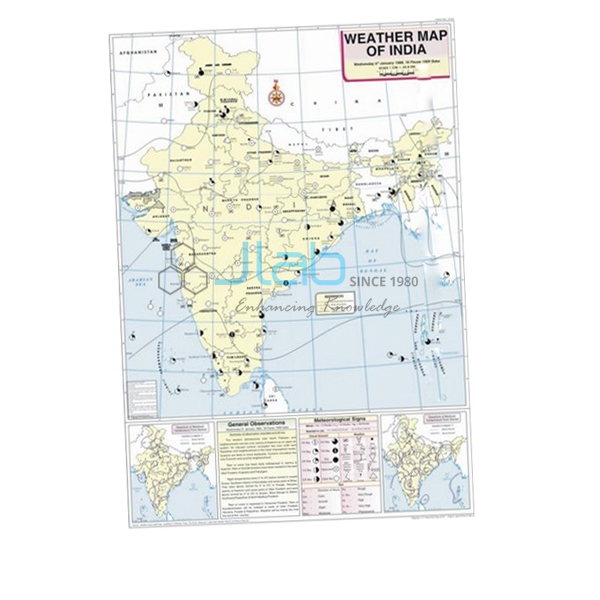
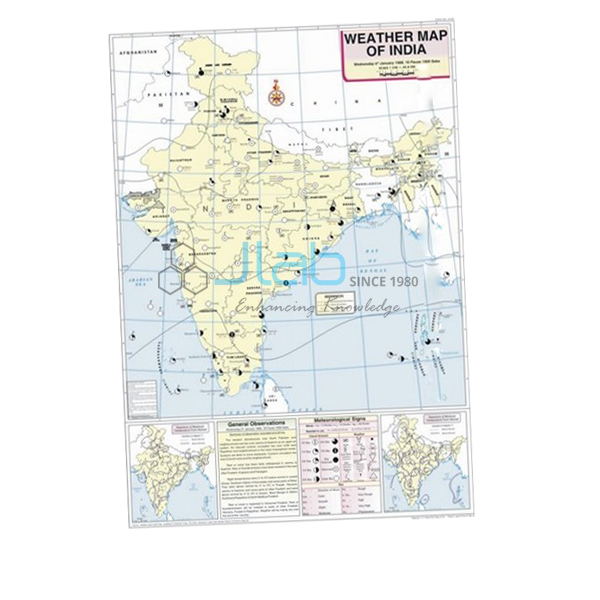
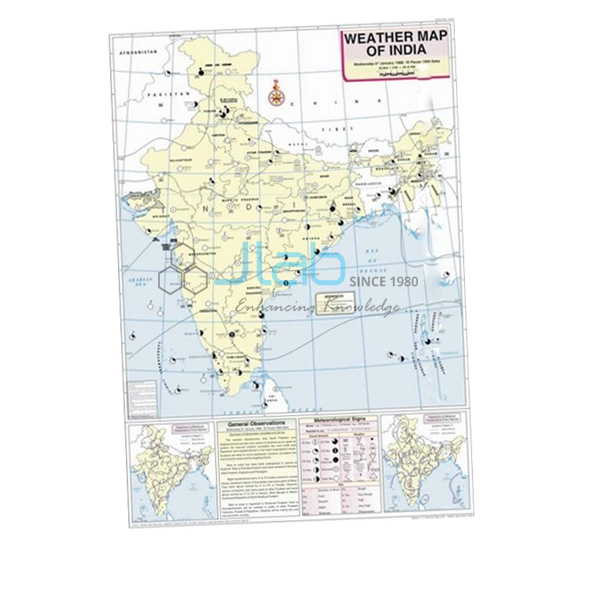
August Map (code EL-WMOI-3168) is a 70 x 100 cm weather map of India for August, used to teach students how a day’s weather is read and recorded in geography lab practicals. It shows important meteorological stations, maximum and minimum temperatures, isobars and meteorological signs, printed in multicolour on white synthetic polyart sheet with plastic rollers. It is made by Jain Laboratory Instruments Pvt Ltd (JLab) at its works in Ambala, India.
Specifications
| Parameter | Detail |
|---|---|
| Map | Weather map of India — August |
| Shows | Locations of important meteorological stations in the country; weather conditions of the day and how to record and depict them; maximum and minimum temperature; isobars and meteorological signs |
| Printing | Multicolour print on white synthetic polyart sheet |
| Rollers | Plastic rollers |
| Size | 70 x 100 cm |
| Language | English |
| Quality check | Each map is visually inspected before dispatch |
| Pack quantity | Each (sold individually) |
| Minimum order quantity | 10 units |
| Dispatch time | Usually 7–10 working days |
| This listing covers | The August map only; the maps for other months and the weather instruments are separate catalogue items |
| Product code | EL-WMOI-3168 |
| Manufacturer | Jain Laboratory Instruments Pvt Ltd (JLab) — OEM |
| Country of origin | India (made in Ambala, Haryana) |
What Is the August Weather Map Used For?
The map is a teaching sheet for weather-map interpretation, a skill covered in the class 11 geography practical chapter on weather instruments, maps and charts and used again in college climatology. Hung on its rollers at the front of the geography lab, it lets a group work through one day’s weather together: locate the meteorological stations, compare their maximum and minimum temperatures, follow the isobars to find where pressure is lowest, and turn each meteorological sign back into words. Because the map also explains how the day’s weather is recorded and depicted, students can use it as a model when they draw their own weather charts. Roll it up on its rollers when it is not on display.
August falls in the middle of India’s south-west monsoon season, and together with July it is the wettest month over most of the country. On an August weather map the monsoon trough usually appears as a belt of low pressure stretching from north-west India towards the head of the Bay of Bengal. Low-pressure systems that form over the bay travel inland along this trough and bring heavy rain to central India, while a northward shift of the trough to the Himalayan foothills produces a “break”: drier days over the plains and heavy rain in the hills and the north-east. Comparing the August map with the January map helps students see how the pressure pattern over India changes between winter and the monsoon.
What to Specify When Ordering
- Months — August on its own, or together with the June, July and September maps if you teach the whole monsoon; JLab lists a separate weather map for each month.
- Quantity — the minimum order is 10 units, enough to cover several geography rooms or a dealer’s stock.
- Language — this map is listed in English.
- Instruments — add a rain gauge or a barometer to the same enquiry if students will compare their own readings with the map.
Frequently Asked Questions
What information does the August Map show?
Important meteorological stations across India, maximum and minimum temperatures, isobars and meteorological signs, together with an explanation of how the day’s weather is recorded and depicted on a map.
What size is the map and what is it printed on?
It measures 70 x 100 cm and is printed in multiple colours on white synthetic polyart sheet, with plastic rollers for hanging it up and rolling it away.
Why is August a useful month for weather-map practice?
It falls in the south-west monsoon season, when the monsoon trough, low-pressure systems moving in from the Bay of Bengal and breaks in the rains give students clear pressure features to find and explain.
Does the map give rainfall figures?
The listing does not mention rainfall totals; it names stations, maximum and minimum temperatures, isobars and meteorological signs. If rainfall data matters for your lesson, ask JLab to confirm the content before you order.
Can I check the August artwork before ordering?
Ask for a photo of the August map when you request a quotation. Checking the artwork first is sensible when a tender lists the exact content it needs.
Are a rain gauge or other instruments included?
No. This listing is the map alone; the rain gauge, barometer and other weather instruments are separate catalogue items and can go on the same enquiry.
What should an export enquiry include?
The quantity, the destination country and port or city, your preferred delivery terms such as FOB or CIF, any packing or labelling requirements, and the tender reference if one applies.
Who manufactures the August Map?
Jain Laboratory Instruments Pvt Ltd, trading as JLab, makes it at its works in Ambala, Haryana, India, and quotes for it directly.
OEM Manufacturer
JLab is the trading name of Jain Laboratory Instruments Pvt Ltd, a manufacturer of geography lab charts, maps and educational laboratory equipment in India, incorporated in 2017 and based on Hargolal Road, Ambala, Haryana. The August map is produced at JLab’s own works instead of being sourced from a trader, so schools, colleges, dealers and importers buy direct from the maker, each map is checked by eye before packing, and repeat orders come from the same manufacturer. The company holds CIN U29309HR2017PTC069123 and is registered as a manufacturing enterprise under MSME Udyam registration UDYAM-HR-01-0003849. JLab exports worldwide and ships to buyers in every region — the USA in North America, Poland in Eastern Europe, Oman in the Middle East, Ireland in Western Europe and Kazakhstan in Central Asia among them. Institutions buying through tenders can find details on the JLab lab tenders page.
Monsoon Maps and Weather Instruments
- July Map — the weather map for the month before August, in the same 70 x 100 cm format.
- September Map — the following month, for continuing the monsoon series.
- Rain Gauge — a case with a removable lid to collect rainfall and a plastic jar marked in centimetres, for comparing rainfall between seasons.
- Aneroid Barometer — measures atmospheric pressure, the quantity that the isobars on the map join up.
- Weather Map Symbols Chart — a wall chart for learning the symbols used on weather maps.
Browse the maps for every month in Weather Maps of India, or see all JLab Charts.
Request a Quote
JLab quotes for the August map directly as its manufacturer. Use the Add To Cart enquiry button on this page, or send the number of maps (minimum 10 units), any other months or weather instruments you want on the same order, and the delivery city or port through the contact page.
Last updated: 4 October 2026