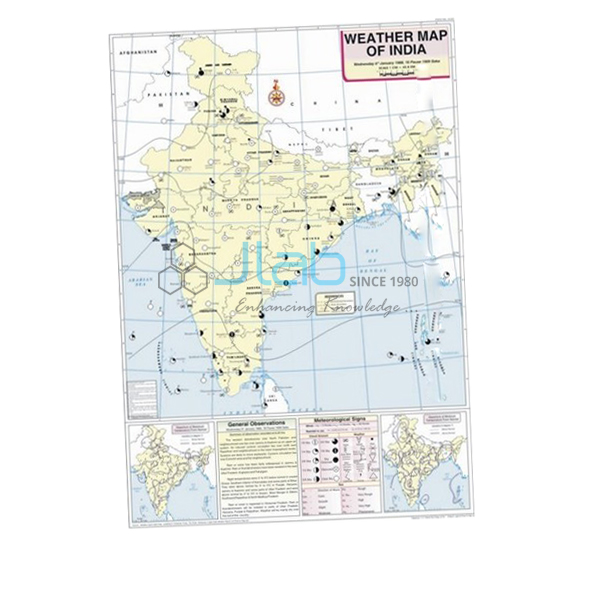
January Map Manufacturer,Supplier and Exporter in India
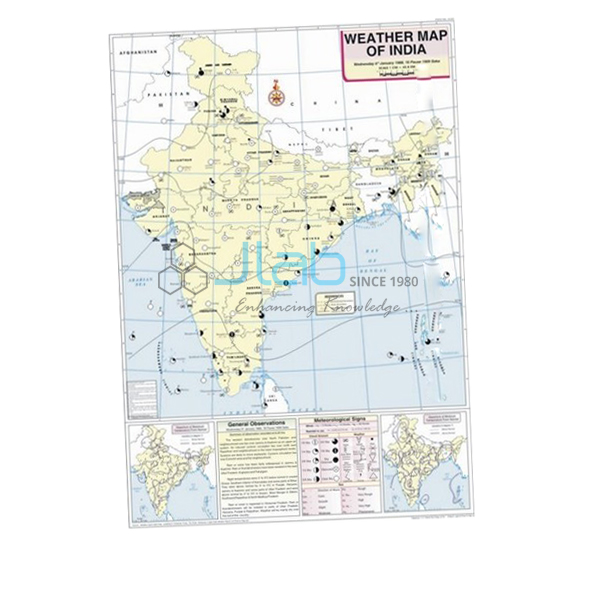
Product Code : EL-WMOI-3160
Jlab Export is a leading January Map Manufacturer,and suppliers in India
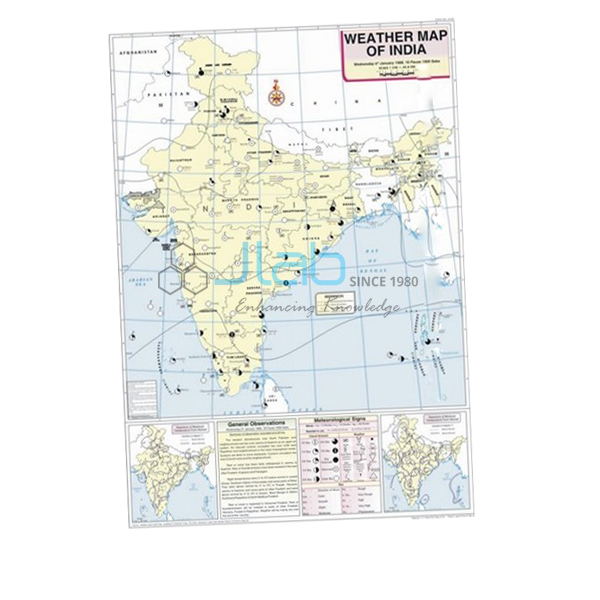
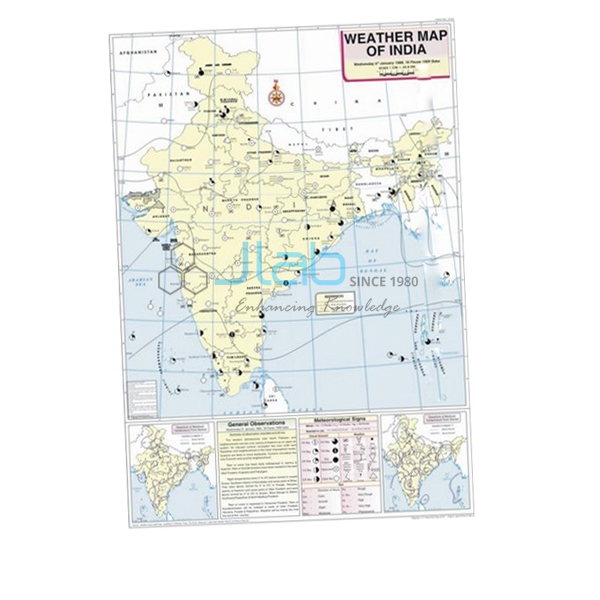
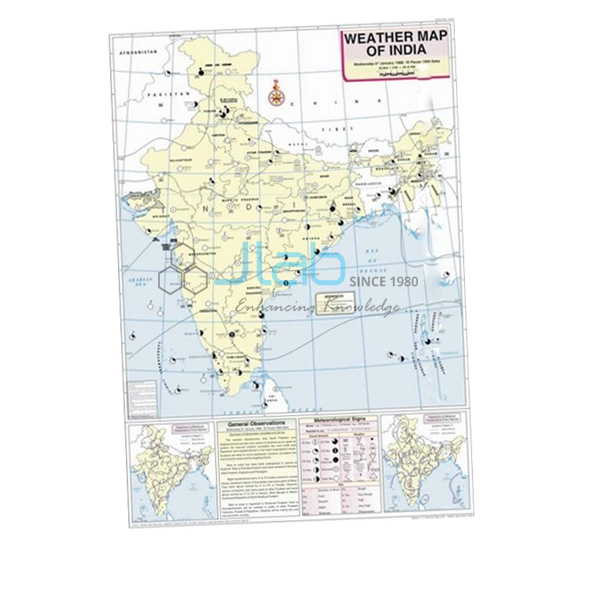
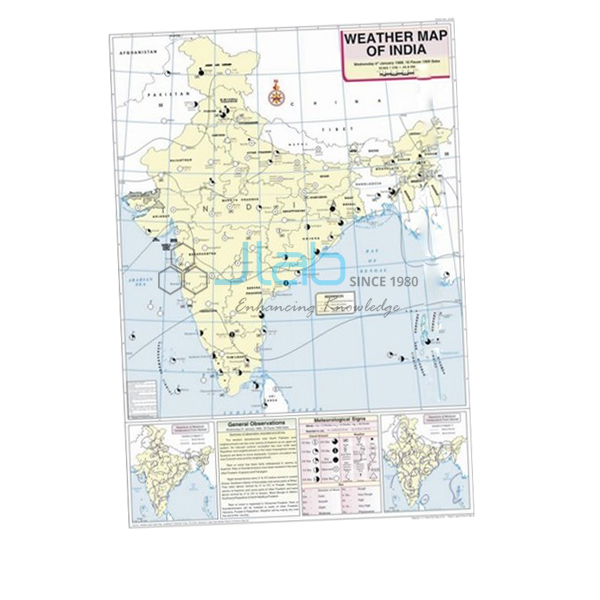
January Map (code EL-WMOI-3160) is a 70 x 100 cm weather map of India for January, used to teach how a day’s weather is recorded and shown on a map in school and college geography practicals. It marks important meteorological stations with their maximum and minimum temperatures, along with isobars and meteorological signs. It is made by Jain Laboratory Instruments Pvt Ltd (JLab) at its works in Ambala, India.
Specifications
| Parameter | Detail |
|---|---|
| Map | Weather map of India — January |
| Shows | Locations of important meteorological stations in the country; weather conditions of the day and how to record and depict them; maximum and minimum temperature; isobars and meteorological signs |
| Printing | Multicolour print on white synthetic polyart sheet |
| Rollers | Plastic rollers |
| Size | 70 x 100 cm |
| Language | English |
| Quality check | Each map is visually inspected before dispatch |
| Pack quantity | Each (sold individually) |
| Minimum order quantity | 10 units |
| Dispatch time | Usually 7–10 working days |
| Product code | EL-WMOI-3160 |
| Manufacturer | Jain Laboratory Instruments Pvt Ltd (JLab) — OEM |
| Country of origin | India (made in Ambala, Haryana) |
What Is the January Weather Map Used For?
Reading weather maps is a standard part of geography map work: the NCERT class 11 practical book has a topic on weather instruments, maps and charts, and college climatology practicals build on the same skills. On this map students find the main meteorological stations, compare their maximum and minimum temperatures, follow the isobars — lines joining places of equal atmospheric pressure — and decode the signs used for wind, cloud and weather. Because it also explains how the day’s conditions are recorded and depicted, the map works as a model when students plot their own observations.
January falls in the winter season, so students read the map against typical January weather in India: high pressure over the north-west, light winds blowing outward from the land, cold nights and fog over the northern plains, and western disturbances — low-pressure systems arriving from the Mediterranean region — that bring winter rain to the north-west and snow to the western Himalaya, which helps the rabi crops. Comparing station temperatures from north to south shows how much milder the peninsula stays. Hang it on its rollers beside the December and February maps to follow the season.
What to Specify When Ordering
- Month — this listing is the January map; every other month has its own listing, so name each month you need.
- Quantity — the minimum order is 10 units; give the number required for each month separately.
- Language — English is listed; ask JLab before ordering if your course needs another language.
- Supporting items — add the weather map symbols chart or weather instruments to the same enquiry.
Frequently Asked Questions
What does the January Map show?
It shows the locations of important meteorological stations across India, the weather conditions of the day and how they are recorded and depicted, maximum and minimum temperatures, and isobars with meteorological signs.
Which classes use a weather map like this?
Mainly geography practicals: the weather instruments, maps and charts topic of the NCERT class 11 practical book, and map-work or climatology practicals in colleges. Teachers also use it in environmental science lessons on reading a weather report.
What weather is typical over India in January?
Cold, mostly dry weather in the north, with high pressure over the north-west, fog in the plains and occasional rain or snow from western disturbances, while the south remains mild. These are the patterns students look for when they interpret a winter weather map.
What is the map printed on?
It is printed in multiple colours on white synthetic polyart sheet, measures 70 x 100 cm and is fitted with plastic rollers for hanging and rolling up.
Can I order maps for the other months as well?
Yes. February through December are separate listings in the same Weather Maps of India range, linked below, and can be quoted together with this one.
OEM Manufacturer
JLab is the trading name of Jain Laboratory Instruments Pvt Ltd, a manufacturer of geography charts, maps and laboratory equipment in India, incorporated in 2017 and based on Hargolal Road, Ambala, Haryana. The weather maps are produced at JLab’s own works rather than bought from a trader, so schools, colleges, dealers and importers order factory-direct, each map is checked by eye before dispatch, and repeat orders come from the maker. JLab holds MSME Udyam registration UDYAM-HR-01-0003849 as a manufacturing enterprise and Importer-Exporter Code 3317504552. It exports worldwide, with buyers in every region — Madagascar in East Africa, Laos in Southeast Asia, Congo in Central Africa, Bangladesh in South Asia and Cyprus in Southern Europe among them. Tender buyers will find details on the JLab lab tenders page.
Related Weather Maps and Instruments
- December Map — the month before, for comparing the start of winter.
- February Map — the following month, as winter begins to ease.
- Weather Map Symbols Chart — a 70 x 100 cm chart of the symbols used on weather maps.
- Thermometer Maximum Minimum Indoor or Outdoor — shows maximum, current and minimum temperature on three LCD screens, for recording the readings the map depicts.
- Aneroid Barometer — measures atmospheric pressure, the quantity that isobars connect.
See every month in the Weather Maps of India range, or browse all JLab Charts.
Request a Quote
Quotes come directly from the manufacturer. Use the Add To Cart enquiry button on this page, or send the months you need, the quantity of each (minimum 10 units), any related charts or instruments, and the delivery city or port through the contact page.
Last updated: 3 October 2026