
Weather Map Symbols Chart Manufacturer,Supplier and Exporter in India
Product Code : EL-COG-3113
Jlab Export is a leading Weather Map Symbols Chart Manufacturer,and suppliers in India
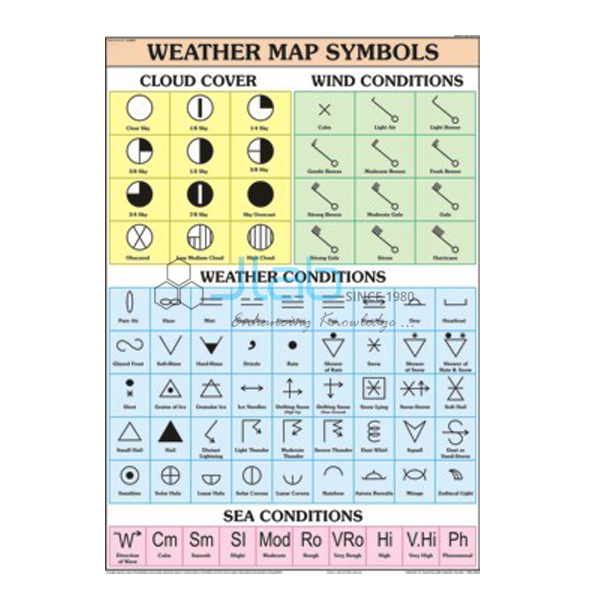
Weather Map Symbols Chart (code EL-COG-3113) is a 70 x 100 cm wall chart that helps students read weather maps by learning the symbols used on them, for geography rooms, school weather clubs and practical geography classes. Buyers choose between an English-only chart and a laminated chart with English and Hindi combined. JLab (Jain Laboratory Instruments Pvt Ltd, Ambala, India) supplies it to schools, colleges and dealers.
Get a quote: use the Add To Cart enquiry button below, or send your quantity and destination through the contact page.
Specifications
| Parameter | Detail |
|---|---|
| Subject | Symbols used on weather maps |
| Chart size | 70 x 100 cm |
| Versions | English only; or English and Hindi combined, laminated |
| English-only version | Finish not stated in the listing — confirm with JLab |
| Symbols shown | Not listed individually; ask for a preview image |
| Quality check | Each chart is visually inspected before dispatch |
| Pack quantity | Each (sold individually) |
| Minimum order quantity | 10 units |
| Dispatch time | Usually 7–10 working days |
| Product code | EL-COG-3113 |
| Supplied by | Jain Laboratory Instruments Pvt Ltd (JLab), Ambala, India |
What Is the Weather Map Symbols Chart Used For?
A weather map packs a great deal of information into a small space by using agreed symbols, and students cannot interpret one until they know them. Isobars are lines joining places of equal air pressure, with H and L marking high- and low-pressure centres. Fronts are drawn as coloured lines — a cold front in blue with triangles, a warm front in red with semicircles, plus occluded and stationary fronts. At each weather station, a shaft shows the wind direction and barbs, or feathers, show its speed, the shading inside a circle shows how much of the sky is covered by cloud, and further symbols mark rain, drizzle, snow, fog and thunderstorms.
With the chart on the wall, students can decode the daily weather maps published by national weather services such as the India Meteorological Department, which is a standard exercise in senior-secondary practical geography. The symbols reproduced on this chart are not listed, so ask for a preview image if it must match a particular syllabus.
What to Specify When Ordering
- Version — English only, or English and Hindi combined with lamination.
- Quantity — at least 10 units.
- Recording equipment — a weather station box and the weather instruments chart if students will also take their own readings.
Frequently Asked Questions
Which symbols are on the Weather Map Symbols Chart?
The listing does not name them. The subject is the standard symbols used on weather maps; ask JLab for a preview image to check the exact set.
What size is it?
The chart is 70 x 100 cm.
In which languages is it available?
English only, or a laminated English and Hindi combined chart.
How is this different from the Conventional Signs Chart?
Conventional signs are the symbols used on topographical and general maps for features such as roads, rivers and settlements; this chart covers the symbols used on weather maps. Both are in the same series and size.
What are the minimum order and dispatch time?
At least 10 units, each sold individually. Charts are usually dispatched within 7–10 working days after a visual inspection; export transit is extra.
Who supplies this chart?
JLab, the trading name of Jain Laboratory Instruments Pvt Ltd in Ambala, Haryana, India, quotes for and supplies it directly.
Supplier
JLab trades on behalf of Jain Laboratory Instruments Pvt Ltd, a company incorporated in 2017 with its base on Hargolal Road, Ambala, Haryana. Its catalogue combines the laboratory and teaching equipment of its own range with supplied items such as this geography chart, so practical geography rooms can be stocked in one order, and each chart is visually checked before dispatch. JLab exports worldwide and ships to buyers in every region — for example Rwanda in East Africa, Qatar in the Middle East, Estonia in Northern Europe, Moldova in Eastern Europe and Myanmar in Southeast Asia. Tender information is on the JLab lab tenders page.
Weather Study Aids
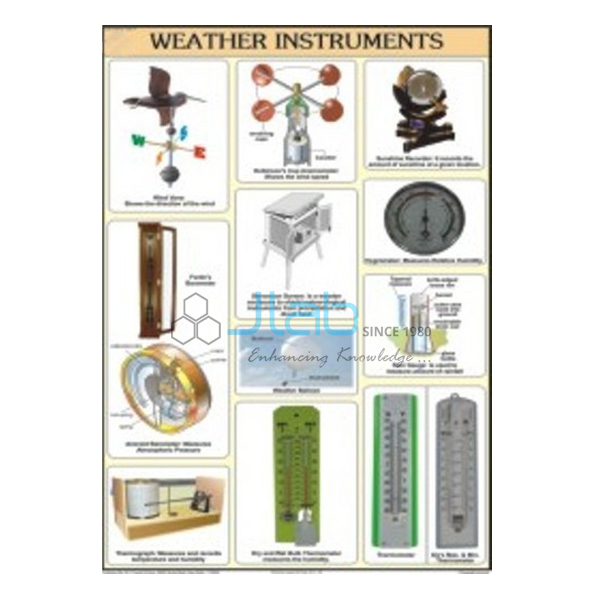
- Weather Instruments Chart — a laminated chart on the instruments used to measure and record weather.
- Pressure and Winds Chart — the same size, on pressure belts and planetary winds.
- Atmosphere and Space Chart — the same size, on the layers of the atmosphere.
- Conventional Signs Chart — the same size, on the signs and symbols used on maps.
- Weather Station — a wooden, louvered station box for mounting weather instruments outdoors.
See the rest of Charts on Geography or the complete Charts list.
Request a Quote
JLab quotes directly. Use the Add To Cart enquiry button or the contact page and give the version, the number of charts (minimum 10 units) and the destination country and city or port.
Last updated: 4 October 2026