Hill Features, Contours and Map Setting Chart Manufacturer,Supplier and Exporter in India
Product Code : EL-COG-3134
Jlab Export is a leading Hill Features, Contours and Map Setting Chart Manufacturer,and suppliers in India
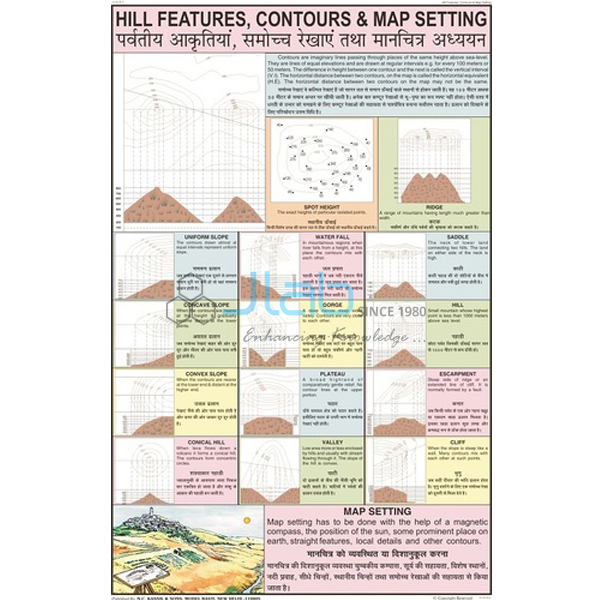
Hill Features, Contours and Map Setting Chart (code EL-COG-3134) is a laminated 50 x 75 cm wall chart for map-reading lessons: how relief is shown by contour lines on a topographical map, how hill features are recognised from them, and how a map is set to the ground. The text is in English and Hindi combined. JLab (Jain Laboratory Instruments Pvt Ltd, Ambala, India) supplies it to schools, colleges and dealers.
Specifications
| Parameter | Detail |
|---|---|
| Topic | Hill features, contours and map setting |
| Size | 50 x 75 cm |
| Finish | Laminated |
| Language | English and Hindi combined |
| Drawings | Not itemised in the listing; a preview image can be requested |
| This listing covers | One chart; compasses and other map-reading charts are separate items |
| Quality check | Each chart is visually inspected before dispatch |
| Pack quantity | Each (sold individually) |
| Minimum order quantity | 10 units |
| Dispatch time | Usually 7–10 working days |
| Product code | EL-COG-3134 |
| Supplied by | Jain Laboratory Instruments Pvt Ltd (JLab), Ambala, India |
What Is the Contours and Map Setting Chart Used For?
A contour line joins points that stand at the same height above mean sea level, and the difference in height between neighbouring lines is the contour interval. Once students can read the pattern, a flat toposheet turns into a landscape. Lines crowded together mean a steep slope and lines spaced widely a gentle one; closed rings that rise towards the centre show a conical hill; V-shaped contours pointing uphill mark a valley, while those pointing downhill mark a spur; a dip between two summits is a saddle, or col; and lines that run into one another show a cliff. This is the heart of the topographical maps chapter in the NCERT class 11 practical geography book, where students also draw cross-sections from contours, and of toposheet work in ICSE geography.
Map setting, or orienting a map, means turning the sheet until its north points to north on the ground, so that every road, stream and hill on paper lines up with the real feature. With a compass, the map is turned until the needle lies along its north line, allowing for the small difference between magnetic north and true north; without one, two landmarks that can be identified both on the ground and on the map are lined up instead. Hung in the geography lab, the chart gives the class a shared reference during map-reading periods and before fieldwork. The listing does not itemise the drawings, so ask for a preview image if your syllabus needs a particular landform shown.
What to Specify When Ordering
- Quantity — at least 10 charts per order.
- Preview — an image of the chart, to compare its landforms with your toposheet syllabus.
- Compasses for field practice — a map compass for setting the sheet, or a prismatic compass for bearings.
- Delivery — destination town or, for export, country, port and FOB or CIF terms, plus any tender reference.
Frequently Asked Questions
What size and finish is this chart?
It is laminated and measures 50 x 75 cm, with English and Hindi combined.
What do contour lines show on a topographical map?
The height and shape of the land. Each line links places at the same height above mean sea level, so the spacing of the lines shows how steep the ground is and their pattern shows landforms such as hills, valleys and spurs.
How can students tell a valley from a spur?
By the direction of the V. In a valley the V-shaped contours point uphill, towards higher ground; on a spur they point downhill. A stream drawn along the V confirms a valley.
How does a cliff appear on a contour map?
As contour lines that crowd together until they almost merge, because the height changes over a very short horizontal distance.
What does map setting mean?
Turning a map so its directions match the directions on the ground, using either a compass or landmarks that can be seen both on the map and in the field.
Which hill features are drawn on the chart?
The listing names the topic but does not list the drawings. Request a preview image before ordering if you need a specific feature such as a plateau or a gorge.
Who supplies this chart?
JLab (Jain Laboratory Instruments Pvt Ltd) of Ambala, Haryana, supplies it and quotes directly.
Supplier
JLab is the trading name of Jain Laboratory Instruments Pvt Ltd, a school laboratory and geography teaching-aid supplier incorporated in 2017, with its base on Hargolal Road, Ambala, Haryana. JLab resells printed map-reading charts such as this one together with the compasses and lab equipment in its own range, so a geography department can source charts and field instruments in one enquiry; each chart is inspected visually before dispatch. JLab exports worldwide and ships to buyers in every region, among them Nepal in South Asia, Turkey in the Middle East, the UK in Western Europe, Senegal in West Africa and Malta in Southern Europe. Tender information is on the JLab lab tenders page.
Map-Reading Charts and Compasses
- Directions and How To Find Them Chart — a laminated 50 x 75 cm chart on the cardinal directions, the first step before setting a map.
- Field Orienting Map Compass — a compass with a liquid-filled chamber that steadies the needle quickly for setting a map outdoors.
- Prismatic Compass — a compass in a brass or aluminium case for taking bearings.
- Conventional Signs Chart — the agreed map symbols read alongside contours on a toposheet.
- Surveying Chart — how distances, directions and heights are measured and turned into maps.
- Physical Features of Earth Chart — the landforms that contours describe.
Browse more Charts on Geography or the full Charts range.
Request a Quote
JLab quotes directly. Use the Add To Cart button on this page or the contact page, and give the number of charts (minimum 10 units), any compasses or companion charts, and the delivery location.
Last updated: 4 October 2026