Sunlight and Rainbow Chart Manufacturer,Supplier and Exporter in India
Product Code : EL-COG-3139
Jlab Export is a leading Sunlight and Rainbow Chart Manufacturer,and suppliers in India
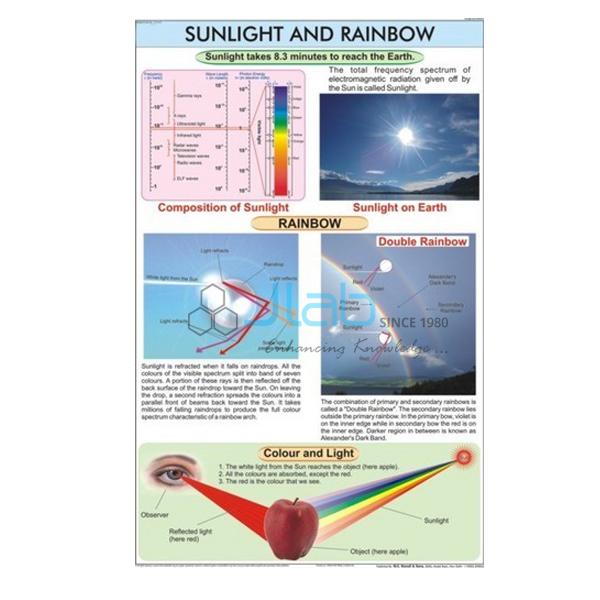
Sunlight and Rainbow Chart (code EL-COG-3139) is a laminated 50 x 75 cm wall chart on sunlight and the rainbow — how the Sun’s white light is made of colours and how raindrops spread those colours across the sky — for science and geography classrooms in primary and secondary schools. The text is bilingual, English and Hindi combined. JLab (Jain Laboratory Instruments Pvt Ltd, Ambala, India) supplies it to schools, colleges and dealers.
Specifications
| Parameter | Detail |
|---|---|
| Subject | Sunlight and the rainbow |
| Size | 50 x 75 cm |
| Finish | Laminated |
| Language | English and Hindi combined |
| Diagrams | Not itemised in the listing; a preview image can be requested |
| This listing covers | One chart; prisms and colour discs are separate catalogue items |
| Quality check | Each chart is visually inspected before dispatch |
| Pack quantity | Each (sold individually) |
| Minimum order quantity | 10 units |
| Dispatch time | Usually 7–10 working days |
| Product code | EL-COG-3139 |
| Supplied by | Jain Laboratory Instruments Pvt Ltd (JLab), Ambala, India |
What Is the Sunlight and Rainbow Chart Used For?
Sunlight looks white but is a mixture of colours. Passing through a glass prism, each colour bends by a slightly different amount — violet most, red least — so the beam opens out into a band called a spectrum, which Indian classrooms remember as VIBGYOR: violet, indigo, blue, green, yellow, orange and red. This splitting is dispersion. A rainbow is the same effect in nature. Sunlight enters a raindrop and bends, reflects off the back of the drop, and bends again as it leaves, so the colours separate and reach the eye from different drops. That is why a rainbow appears only when the Sun is behind you and rain is falling in front, most often after a shower in the morning or late afternoon, with red on the outside of the bow and violet on the inside; a fainter second bow, when there is one, has its colours reversed.
The ideas are taught formally in the NCERT class 10 science chapter on the human eye and the colourful world, which also explains why the sky is blue and why the Sun looks reddish at sunrise and sunset, and they appear earlier in primary and middle-school lessons on light. Teachers often pair the chart with a prism held in a sunbeam and a Newton’s colour disc, which looks almost white when it spins fast. The individual diagrams are not listed in the catalogue entry, so ask for a preview image if you need a particular topic, such as scattering, covered.
What to Specify When Ordering
- Number of charts — 10 units minimum.
- Demonstration items — a glass prism and a Newton’s colour disc let the class reproduce what the chart shows.
- Further light charts — the solar spectrum chart takes older students on to the dark lines in the Sun’s spectrum.
- Shipping details — destination, FOB or CIF terms for export, and any tender reference.
Frequently Asked Questions
Why does a prism split sunlight into colours?
Because each colour travels at a slightly different speed in glass and so bends by a different amount. Violet bends most and red least, which spreads the colours into a spectrum.
How is a rainbow formed?
Raindrops act like tiny prisms. Light is refracted as it enters a drop, reflected inside it and refracted again on the way out, separating the colours. You see the bow only with the Sun behind you and rain in front.
Why is the sky blue?
Air scatters blue light from the Sun far more strongly than red light, so blue reaches the eye from every part of the sky. At sunrise and sunset the light crosses much more air, the blue is scattered away, and the Sun looks red or orange.
What size is the chart and which languages does it use?
It is 50 x 75 cm and laminated, with English and Hindi on the same chart.
Is a prism included?
No. The listing covers the chart only. Glass prisms and Newton’s colour discs are separate products that can be quoted in the same enquiry.
Who supplies this chart?
Jain Laboratory Instruments Pvt Ltd, trading as JLab, of Ambala, Haryana, supplies it and answers enquiries directly.
Supplier
JLab is the trading name of Jain Laboratory Instruments Pvt Ltd, a supplier of physics, geography and general school laboratory equipment, incorporated in 2017 and based on Hargolal Road, Ambala, Haryana. JLab resells printed teaching charts like this one together with the optics items in its own range, so a science department can order the chart, prisms and discs together; every chart is visually checked before dispatch. JLab exports worldwide and ships to buyers in every region — for instance Eswatini in Southern Africa, Vietnam in Southeast Asia, Denmark in Northern Europe, Lebanon in the Middle East and Sudan in North Africa. Tender buyers will find details on the JLab lab tenders page.
Light Demonstrations and Companion Charts
- Glass Prism — an equilateral glass prism for light experiments in the lab.
- Newton’s Color Disc — a disc in the spectrum colours, turned by a wheel and handle on its stand.
- Solar Spectrum Chart JLab — the visible solar spectrum with its more prominent Fraunhofer lines.
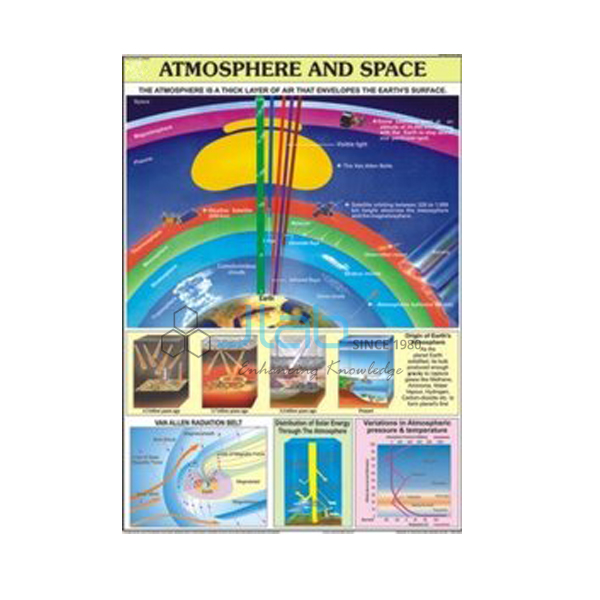
- Atmosphere and Space Chart — the blanket of air around the Earth and how it thins into space.
- Season Chart — why the seasons change as the Earth orbits the Sun on its tilted axis.
- Day and Night Chart — how the turning Earth brings sunlight and darkness.
Browse more Charts on Geography or the full Charts range.
Request a Quote
For a quotation from JLab, use the Add To Cart button on this page or the contact page, and give the number of charts (minimum 10 units), any prisms or discs you need, and the delivery destination.
Last updated: 4 October 2026