Tides Chart Manufacturer,Supplier and Exporter in India
Product Code : EL-COG-3122
Jlab Export is a leading Tides Chart Manufacturer,and suppliers in India
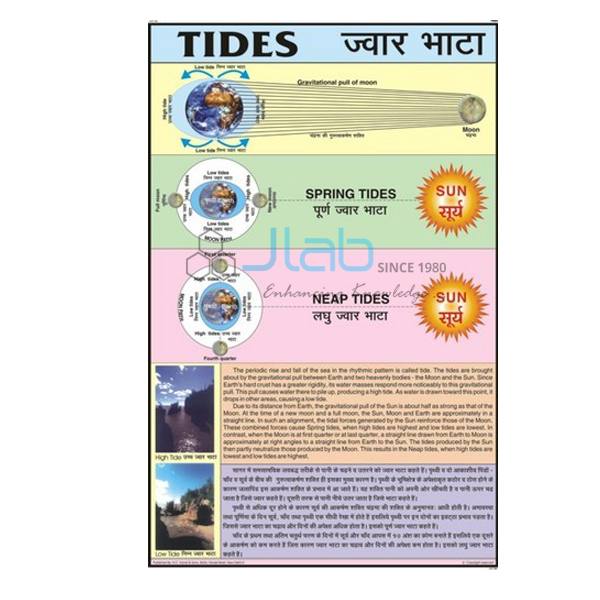
Tides Chart (code EL-COG-3122) is a laminated 50 x 75 cm wall chart on the tides — the regular rise and fall of the sea along the coast and the pull of the Moon and Sun behind it — for school geography and science lessons on the oceans. English and Hindi are printed together on one chart. JLab (Jain Laboratory Instruments Pvt Ltd, Ambala, India) supplies it to schools, colleges and dealers.
Specifications
| Parameter | Detail |
|---|---|
| Subject | Tides |
| Size | 50 x 75 cm |
| Finish | Laminated |
| Language | English and Hindi combined |
| Diagrams | Not described in the listing; ask JLab for a preview image |
| Quality check | Each chart is visually inspected before dispatch |
| Pack quantity | Each (sold individually) |
| Minimum order quantity | 10 units |
| Dispatch time | Usually 7–10 working days |
| Product code | EL-COG-3122 |
| Supplied by | Jain Laboratory Instruments Pvt Ltd (JLab), Ambala, India |
What Is the Tides Chart Used For?
Tides are easiest to understand with a diagram of the Earth, the Moon and the Sun in front of the class. The Moon’s gravity, helped to a smaller extent by the Sun’s, pulls the oceans into two bulges — one on the side facing the Moon and one on the far side — and as the Earth rotates, most coasts pass through two high tides and two low tides in a little more than a day. When the Sun, Moon and Earth are in line, at new moon and full moon, the pulls combine and give spring tides with the greatest range; near the first and last quarter, when the Sun and Moon pull at right angles, the range is smallest and the tides are called neap tides. The word “spring” here has nothing to do with the season.
Lessons then turn to why tides matter: ships enter some harbours on the high tide, fishing follows the tides, and tidal energy can be harnessed — the Gulf of Khambhat and the Gulf of Kachchh, with their large tidal ranges, are the Indian examples usually given. The topic is part of middle-school geography and of class 11 physical geography on the movements of ocean water. Ask for a preview image if you need to check the diagrams.
What to Specify When Ordering
- Quantity — 10 units minimum.
- Preview — ask for an image of the chart if it must match your textbook.
- Companion charts — phases of the Moon, eclipse and ocean current charts complete the topic.
Frequently Asked Questions
What size is the Tides Chart?
It is 50 x 75 cm and laminated.
Is the chart bilingual?
Yes. English and Hindi are combined on the same chart.
What is the difference between spring and neap tides?
Spring tides happen at new and full moon, when the Sun and Moon pull in line and the tidal range is greatest; neap tides happen near the quarter moons, when they pull at right angles and the range is smallest.
Who supplies this chart?
JLab, the trading name of Jain Laboratory Instruments Pvt Ltd in Ambala, Haryana, India, supplies it and quotes directly.
Supplier
JLab is the trading name of Jain Laboratory Instruments Pvt Ltd, incorporated in 2017 and based on Hargolal Road, Ambala, Haryana. JLab supplies geography teaching charts such as this one side by side with the laboratory and teaching equipment in its own range, making it simple for schools and dealers to equip a geography room in one order, and it checks every chart visually before dispatch. JLab exports worldwide and ships to buyers in every region — for example Canada in North America, Brazil in South America, Australia in Oceania, Tunisia in North Africa and the Czech Republic in Eastern Europe. Tender buyers will find details on the JLab lab tenders page.
Moon and Ocean Charts
- Phases of the Moon Chart — why the Moon appears to change shape, which sets the timing of spring and neap tides.
- Solar and Lunar Eclipse Chart — another Sun–Earth–Moon alignment topic.
- Ocean Currents Chart — the great streams of warm and cold water in the oceans.
- Storm and Ocean Current Chart — a larger chart on storms and currents.
- Ocean Charts — a larger chart on the oceans and the ocean floor.
More in Charts on Geography and Charts.
Request a Quote
JLab quotes directly. Send the quantity (minimum 10 units) and the delivery destination using the Add To Cart enquiry button or the contact page.
Last updated: 4 October 2026