Atmosphere and Space Chart Manufacturer,Supplier and Exporter in India
Product Code : EL-COG-3111
Jlab Export is a leading Atmosphere and Space Chart Manufacturer,and suppliers in India
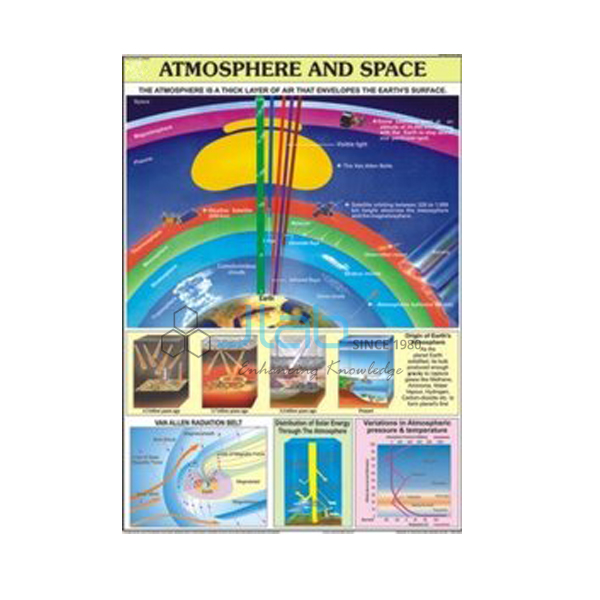
Atmosphere and Space Chart (code EL-COG-3111) is a 70 x 100 cm geography wall chart on the blanket of air around the Earth and the way it thins out into space, used when classes study the layers and make-up of the atmosphere. Two versions are listed: English only, and a laminated chart with English and Hindi combined. JLab (Jain Laboratory Instruments Pvt Ltd, Ambala, India) supplies it to schools, colleges and dealers.
Specifications
| Parameter | Detail |
|---|---|
| Subject | The atmosphere and space |
| Size | 70 x 100 cm |
| Language versions | English only; or English and Hindi combined, laminated |
| Panels | Not described in the listing; preview image on request |
| Quality check | Each chart is visually inspected before dispatch |
| Pack quantity | Each (sold individually) |
| Minimum order quantity | 10 units |
| Dispatch time | Usually 7–10 working days |
| Product code | EL-COG-3111 |
| Supplied by | Jain Laboratory Instruments Pvt Ltd (JLab), Ambala, India |
What Is the Atmosphere and Space Chart Used For?
It gives a class a single picture of the atmosphere from the ground upwards. The atmosphere is an envelope of air held to the Earth by gravity, made up mostly of nitrogen and oxygen with smaller amounts of argon, carbon dioxide and water vapour. It is divided into layers: the troposphere, where weather happens and temperature generally falls with height; the stratosphere, which holds the ozone layer that absorbs much of the Sun’s ultraviolet radiation; the mesosphere, where most meteors burn up; the thermosphere, which contains the ionosphere that reflects radio waves; and the exosphere, which fades into space. Air becomes thinner, and pressure lower, the higher you go.
The chart is useful in middle-school geography and science, and in class 11 physical geography where the composition and structure of the atmosphere is studied, before the class moves on to pressure, winds and weather. The panels are not described in the listing, so ask JLab for a preview image to check the layer names and labels.
What to Specify When Ordering
- Language — English only, or laminated English and Hindi combined.
- Order size — 10 units minimum.
- Weather unit — the pressure and winds, weather map symbols and weather instruments charts can be added to the same quotation.
- Shipping — destination, preferred delivery terms and any tender reference.
Frequently Asked Questions
What topic does the Atmosphere and Space Chart cover?
The Earth’s atmosphere and how it gives way to space. The exact panels and labels are not listed, so request a preview image if you need to check them.
What size is the chart?
70 x 100 cm.
Can I get it in Hindi?
Yes, as a laminated version with English and Hindi combined. There is also an English-only version.
Which other charts go with it?
The Pressure and Winds Chart and the Weather Map Symbols Chart are in the same size, and the Weather Instruments Chart covers how weather is measured; all are linked below.
Who supplies this chart?
JLab (Jain Laboratory Instruments Pvt Ltd), Ambala, Haryana, India, which handles the quotation and supply directly.
Supplier
JLab is the trading name of Jain Laboratory Instruments Pvt Ltd, which was incorporated in 2017 and operates from Hargolal Road, Ambala, Haryana. The company supplies geography wall charts as well as the laboratory and teaching equipment in its own range, giving schools and dealers one point of contact for a geography room, and every chart is visually inspected before it ships. JLab exports worldwide and ships to buyers in every region — for example Kyrgyzstan in Central Asia, Panama in Central America and the Caribbean, Moldova in Eastern Europe, South Africa in Southern Africa and Congo in Central Africa. For tender buying, see the JLab lab tenders page.
Weather and Climate Charts
- Pressure and Winds Chart — the same size, on pressure belts and planetary winds.
- Weather Map Symbols Chart — the same size, on the symbols used on weather maps.
- Weather Instruments Chart — a laminated chart on the instruments used to measure and record weather.
- Factors that Affect Climate Chart — why the climate of one place differs from another.
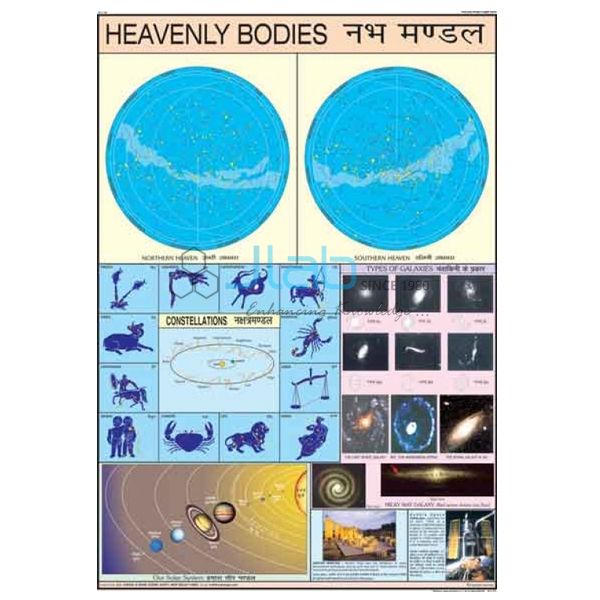
- Heavenly Bodies Chart — for the space side of the topic: stars, planets and moons.
More titles: Charts on Geography and Charts.
Request a Quote
Send your enquiry with the Add To Cart button or via the contact page, listing the version, the quantity (minimum 10 units) and the delivery location, and JLab will quote directly.
Last updated: 4 October 2026