
Factors that Affect Climate Chart Manufacturer,Supplier and Exporter in India
Product Code : EL-COG-3135
Jlab Export is a leading Factors that Affect Climate Chart Manufacturer,and suppliers in India
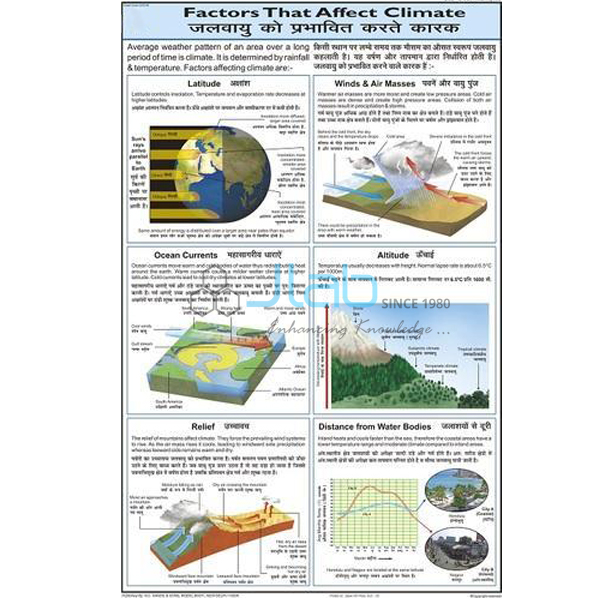
Factors that Affect Climate Chart (code EL-COG-3135) is a laminated 50 x 75 cm geography wall chart for the climate unit — why one place is hotter, wetter or more extreme than another — used in school geography rooms and social science classes. It is bilingual, with English and Hindi combined on one sheet. JLab (Jain Laboratory Instruments Pvt Ltd, Ambala, India) supplies it to schools, colleges and dealers.
Get a quote: use the Add To Cart enquiry button below, or send your quantity and destination through the contact page.
Specifications
| Parameter | Detail |
|---|---|
| Subject | Factors that affect climate |
| Size | 50 x 75 cm |
| Finish | Laminated |
| Language | English and Hindi combined |
| Panels | Not itemised in the listing; a preview image can be requested |
| Quality check | Each chart is visually inspected before dispatch |
| Pack quantity | Each (sold individually) |
| Minimum order quantity | 10 units |
| Dispatch time | Usually 7–10 working days |
| Product code | EL-COG-3135 |
| Supplied by | Jain Laboratory Instruments Pvt Ltd (JLab), Ambala, India |
What Is the Climate Factors Chart Used For?
Weather is the state of the air at one place and time; climate is the pattern of that weather averaged over many years. The NCERT class 9 geography chapter on climate lists the controls that shape it: latitude, altitude, the pressure and wind system, distance from the sea, ocean currents and relief. Latitude decides how high the Sun climbs and how much of its energy arrives, so temperatures generally drop from the equator towards the poles. Height matters because the air grows thinner and usually cooler as you climb, which is why hill stations such as Shimla and Darjeeling are pleasant when the plains below are hot. Distance from the sea sets the range of temperature: water warms and cools slowly, so coastal Mumbai stays mild all year while inland Delhi has hot summers and cold winters — the effect called continentality.
The remaining controls show how air and water move heat and moisture around. The monsoon winds bring most of India’s rain; the warm North Atlantic Drift keeps north-western Europe milder than its latitude suggests; and mountain ranges can stop rain-bearing winds, leaving a dry rain shadow on the far side, as on the Deccan plateau east of the Western Ghats. With the chart on the wall, the class can return to these ideas through the whole climate unit and later when comparing climatic regions. The listing does not say which factors are illustrated, so ask for a preview image if your scheme of work needs all of them.
What to Specify When Ordering
- Number of charts — at least 10 units.
- Preview — an image of the chart, to check which climate controls it shows.
- Companion titles — pressure and winds, ocean currents and season charts cover the same unit from other angles.
- Shipping — delivery city and country, with FOB or CIF terms for an export order.
Frequently Asked Questions
What is the difference between weather and climate?
Time scale. Weather is what the atmosphere is doing over hours or days; climate is the long-term average of those conditions in a region, built up over decades.
Why is it cooler at higher altitudes?
Because the air is thinner and is warmed mainly from the ground. Rising air expands and cools, so the temperature generally falls with height, and mountain towns stay cooler than nearby plains.
What does continentality mean?
The effect of distance from the sea. Places far inland heat up and cool down more strongly than coastal places, so the gap between their summer and winter temperatures is larger.
What is a rain shadow?
A dry area on the sheltered side of a mountain range. Moist winds rise and drop their rain on the windward slopes, and the air that descends on the other side is dry.
Does the chart cover every factor in the syllabus?
The listing gives only the title, size, finish and language, not the individual panels. Ask JLab for a preview image before ordering.
What size is the chart, and is it bilingual?
Yes, it is bilingual — English and Hindi combined — on a laminated chart of 50 x 75 cm.
How many must I order, and when will they ship?
The minimum is 10 units, sold as single charts. They usually ship within 7–10 working days after a visual check; overseas transit is extra and depends on the route.
Who supplies this climate chart?
JLab — Jain Laboratory Instruments Pvt Ltd, Ambala, Haryana — supplies it and quotes for it directly.
Supplier
JLab is the trading name of Jain Laboratory Instruments Pvt Ltd, a teaching-aid and school laboratory equipment company incorporated in 2017 and based on Hargolal Road, Ambala, Haryana. It resells printed geography charts like this one together with its own range of laboratory and weather-recording equipment, which saves schools and dealers from dealing with several suppliers, and it checks each chart visually before dispatch. JLab exports worldwide and ships to buyers in every region — Malaysia in Southeast Asia, Belgium in Western Europe, Costa Rica in Central America and the Caribbean, Namibia in Southern Africa and Japan in East Asia, for instance. Tender information is on the JLab lab tenders page.
Charts for the Weather and Climate Unit
- Pressure and Winds Chart — atmospheric pressure and the winds it drives.
- Ocean Currents Chart — a laminated 50 x 75 cm chart on the warm and cold streams of the oceans.
- Atmosphere and Space Chart — the layers and make-up of the air around the Earth.
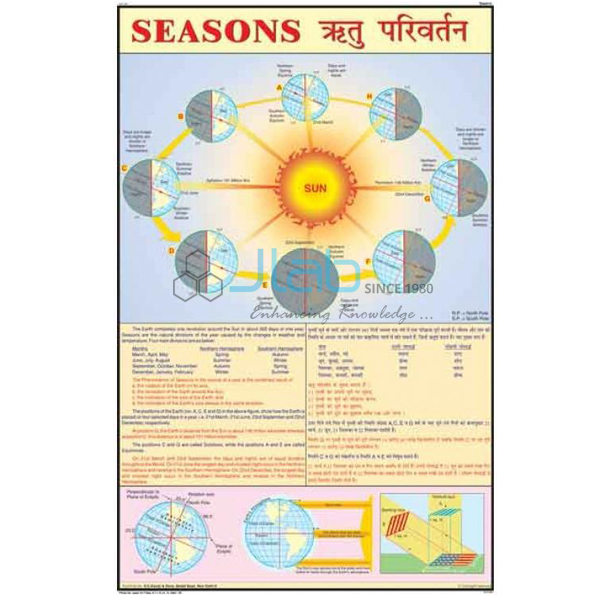
- Season Chart — why the seasons change as the Earth orbits the Sun on its tilted axis.
- Weather Instruments Chart — the instruments used to measure and record weather.
- Weather and Climate Poster — graphics and photos linking weather with climate.
Browse more Charts on Geography or the full Charts range.
Request a Quote
Send your enquiry straight to JLab with the Add To Cart button on this page or through the contact page, giving the quantity (minimum 10 units), any companion charts and the delivery destination.
Last updated: 4 October 2026