
Day and Night Chart Manufacturer,Supplier and Exporter in India
Product Code : EL-COG-3130
Jlab Export is a leading Day and Night Chart Manufacturer,and suppliers in India
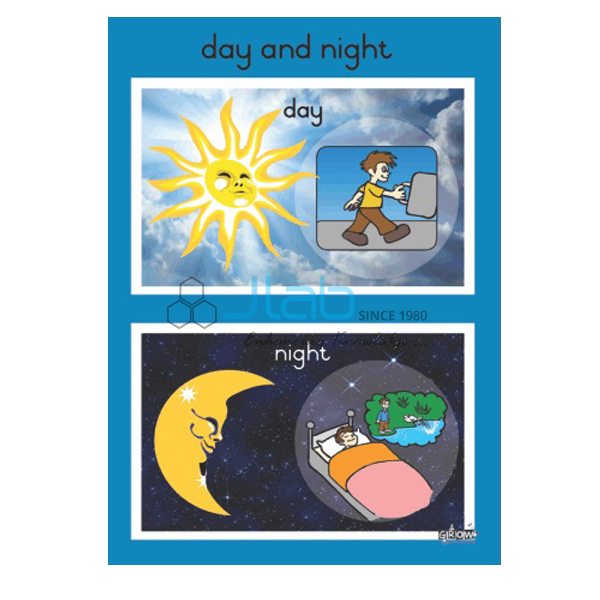
Day and Night Chart (code EL-COG-3130) is a laminated 50 x 75 cm geography wall chart on day and night, used when primary and middle-school classes learn how the spinning Earth carries each place into sunlight and back into darkness. English and Hindi are printed together on the one sheet. JLab (Jain Laboratory Instruments Pvt Ltd, Ambala, India) supplies it to schools, colleges and dealers.
Get a quote: use the Add To Cart enquiry button below, or send your quantity and destination through the contact page.
Specifications
| Parameter | Detail |
|---|---|
| Topic | Day and night |
| Size | 50 x 75 cm |
| Finish | Laminated |
| Language | English and Hindi combined |
| Diagrams | Not itemised in the listing; a preview image can be requested |
| This listing covers | One chart; globes and Sun–Earth–Moon models are separate items |
| Quality check | Each chart is visually inspected before dispatch |
| Pack quantity | Each (sold individually) |
| Minimum order quantity | 10 units |
| Dispatch time | Usually 7–10 working days |
| Product code | EL-COG-3130 |
| Supplied by | Jain Laboratory Instruments Pvt Ltd (JLab), Ambala, India |
What Is the Day and Night Chart Used For?
The Earth turns on its axis from west to east, making roughly one full turn each day. At any moment the half that faces the Sun is in daylight and the other half is in night; the line dividing them is the circle of illumination. Because the turn is from west to east, the Sun seems to rise in the east and set in the west, and places further east see it first — sunrise reaches Arunachal Pradesh well before it reaches Gujarat. NCERT class 6 geography introduces these ideas in its chapter on the motions of the Earth, where rotation is taught together with revolution.
Day length also changes with latitude and season because the axis is tilted. Close to the equator day and night stay nearly equal all year; at the equinoxes they are roughly equal everywhere; towards the poles the difference grows until summer brings continuous daylight and winter continuous darkness. A globe and a torch in a darkened room make the chart’s message easy to see: turn the globe slowly from west to east and watch towns slip into shadow and out again. Ask for a preview image if the chart must match the figures in your textbook.
What to Specify When Ordering
- Quantity — the minimum order is 10 charts, sold individually.
- Preview — request an image of the chart to check its diagrams against your syllabus.
- Globe or model — for the torch-and-globe demonstration that goes with the chart.
- Delivery — your town or, for export, the destination country, port and delivery terms such as FOB or CIF.
Frequently Asked Questions
What size is the Day and Night Chart, and which languages does it use?
It measures 50 x 75 cm and is laminated, with English and Hindi combined on the same chart.
What causes day and night?
The rotation of the Earth on its axis. The side facing the Sun has day, and as the planet turns from west to east each place moves into darkness and then back into sunlight.
What is the circle of illumination?
It is the imaginary line that separates the lit half of the Earth from the dark half. Places lying on it are at sunrise or sunset at that moment.
Why are summer days longer than winter days?
Because the Earth’s axis is tilted. When your hemisphere leans towards the Sun, more of each turn is spent in daylight; half a year later the opposite happens.
Which diagrams does the chart include?
The listing gives the topic, size, finish and language but does not itemise the drawings. Ask JLab for a preview image before ordering if a particular diagram matters.
What are the minimum order and dispatch time?
The minimum is 10 units, supplied individually. Dispatch is usually within 7–10 working days after each chart is checked visually; transit time for export orders is extra.
Who supplies this chart?
JLab — Jain Laboratory Instruments Pvt Ltd of Ambala, Haryana, India — supplies it and sends quotations directly.
Supplier
JLab is the trading name of Jain Laboratory Instruments Pvt Ltd, a school laboratory equipment and teaching-aid company incorporated in 2017 and based on Hargolal Road, Ambala, Haryana. Alongside the equipment in its own range, JLab resells printed geography charts such as this one, so a school or dealer can order wall charts, globes and lab items from a single supplier, and each chart is inspected by eye before it is packed. JLab exports worldwide and ships to buyers in every region — for example Paraguay in South America, Uzbekistan in Central Asia, Lithuania in Northern Europe, North Macedonia in Southern Europe and Lesotho in Southern Africa. Tender details are on the JLab lab tenders page.
Charts, Globes and Models for the Same Lesson
- Season Chart — a laminated 50 x 75 cm chart on why the seasons change as the Earth orbits the Sun on its tilted axis.
- Earth Is Round Chart — the shape of the Earth and the evidence that it is round.
- Latitude and Longitude Chart — parallels, meridians and the link between longitude and time.
- Physical Globe — a globe with a timescale and a laminated surface that can be marked and wiped clean.
- Tellurium Earth Moon Sun Model — a hand-operated, belt-driven tellurium listed for day and night, the seasons and eclipses.
- Elementary Planetarium Model For Earth Science Lab — a hand-operated Sun–Earth–Moon model showing how the three bodies move together over a year.
Browse more Charts on Geography or the full Charts range.
Request a Quote
Quotations come directly from JLab. Use the Add To Cart enquiry button on this page or the contact page, and send the number of charts (minimum 10 units), any globe or model you want quoted with them, and the delivery destination.
Last updated: 4 October 2026