Earthquake Chart Manufacturer,Supplier and Exporter in India
Product Code : EL-COG-3131
Jlab Export is a leading Earthquake Chart Manufacturer,and suppliers in India
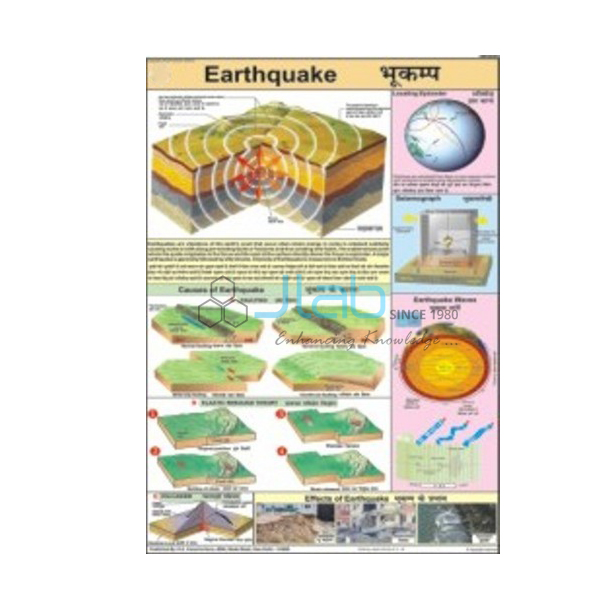
Earthquake Chart (code EL-COG-3131) is a laminated 50 x 75 cm wall chart on earthquakes — why the ground shakes, how the shaking travels and how it is recorded — for geography, earth science and disaster-preparedness lessons in schools. Its text appears in English and Hindi on the same sheet. JLab (Jain Laboratory Instruments Pvt Ltd, Ambala, India) supplies it to schools, colleges and dealers.
Specifications
| Parameter | Detail |
|---|---|
| Topic | Earthquakes |
| Size | 50 x 75 cm |
| Finish | Laminated |
| Language | English and Hindi combined |
| Panels | Not itemised in the listing; a preview image can be requested |
| This listing covers | One chart; seismograph and volcano models are separate catalogue items |
| Quality check | Each chart is visually inspected before dispatch |
| Pack quantity | Each (sold individually) |
| Minimum order quantity | 10 units |
| Dispatch time | Usually 7–10 working days |
| Product code | EL-COG-3131 |
| Supplied by | Jain Laboratory Instruments Pvt Ltd (JLab), Ambala, India |
What Is the Earthquake Chart Used For?
An earthquake is a sudden shaking of the ground that happens when stress built up in the rocks of the crust is released, most often as rocks slip along a fault close to the edges of the tectonic plates. The point underground where the rupture starts is the focus, or hypocentre; the point on the surface directly above it is the epicentre. From there the energy spreads as seismic waves. P waves are the fastest and can pass through solids, liquids and gases; S waves are slower and travel only through solids; surface waves arrive last and do most of the damage. A seismograph records all three, and because S waves cannot cross the outer core, these records are also how scientists learned that part of the Earth’s interior is liquid — a point students meet in the class 11 physical geography chapter on the interior of the Earth.
The chart is equally useful for safety teaching. The Himalayan belt and the north-east are among the most earthquake-prone parts of India, and the national seismic zoning map grades the country into zones of rising hazard, so a lesson on the science leads naturally into a school drill: drop, take cover under a sturdy desk, and hold on until the shaking stops. The listing does not describe the individual panels, so request a preview image if your lesson plan depends on a particular diagram.
What to Specify When Ordering
- Number of charts — at least 10 units per order.
- Preview — ask for an image of the chart to compare with your textbook.
- Models — a seismograph or volcano model can be quoted in the same enquiry.
- Delivery details — destination town, or country and port with FOB or CIF terms for export.
Frequently Asked Questions
What size and finish is the Earthquake Chart?
It is 50 x 75 cm and laminated, with English and Hindi printed together.
What is the difference between the focus and the epicentre?
The focus is the point inside the Earth where the rock first breaks; the epicentre is the point on the surface straight above it, where the shaking is usually strongest.
Which earthquake waves arrive first?
P waves. They are the fastest seismic waves, followed by S waves and then the surface waves, which cause most of the damage to buildings.
What is the difference between magnitude and intensity?
Magnitude measures the energy released by the earthquake itself, on the Richter or moment-magnitude scale. Intensity, on scales such as the Modified Mercalli scale, describes how strongly the shaking was felt at a particular place.
What should students do when the ground starts shaking?
Drop to the floor, take cover under a sturdy desk or table, and hold on until the shaking stops, keeping away from windows. Move to an open area only once the shaking has ended.
Which diagrams are printed on the chart?
The listing names the topic but not the individual panels. Ask JLab for a preview image before you order if a specific diagram is needed.
Who supplies this chart?
JLab, the trading name of Jain Laboratory Instruments Pvt Ltd in Ambala, Haryana, supplies it and quotes for it directly.
Supplier
JLab is the trading name of Jain Laboratory Instruments Pvt Ltd, an Indian company supplying school laboratory equipment and teaching aids, incorporated in 2017 and located on Hargolal Road, Ambala, Haryana. This chart is one of the printed geography titles JLab resells next to its own range of laboratory equipment and earth science models, which lets schools and dealers put charts and lab items on one order; every chart is looked over by eye before dispatch. JLab exports worldwide and serves buyers in every region — Bolivia in South America, Trinidad and Tobago in Central America and the Caribbean, Nepal in South Asia, Fiji in Oceania and Congo in Central Africa are some examples. Tender buyers can find information on the JLab lab tenders page.
Related Earth Science Charts and Models
- Seismograph Model For Earth Science Lab — shows students how the intensity of earthquakes is measured.
- Volcano Chart — the companion laminated 50 x 75 cm chart on volcanoes.
- Volcano Model — a hand-painted cutaway model of the inside of a volcano.
- Structure of Earth Chart — the crust, mantle and core that seismic waves reveal.
- Physical Features of Earth Chart — the landforms on the Earth’s surface.
- Rocks and Volcanoes 3D Model — a rigid PVC relief model of the main rock types and volcanoes, with a markable, washable surface.
Browse more Charts on Geography or the full Charts range.
Request a Quote
JLab replies to enquiries directly. Click Add To Cart on this page or use the contact page, and tell us the quantity (minimum 10 units), any models or companion charts, and where the order is to be delivered.
Last updated: 4 October 2026