Pressure and Winds Chart Manufacturer,Supplier and Exporter in India
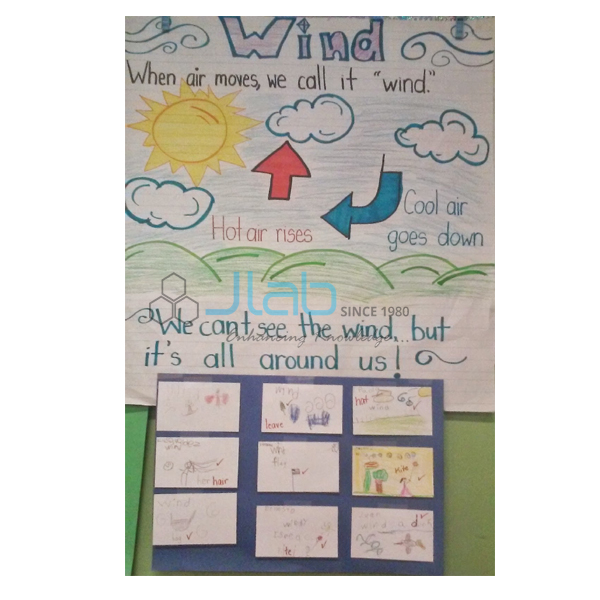
Product Code : EL-COG-3112
Jlab Export is a leading Pressure and Winds Chart Manufacturer,and suppliers in India
Pressure and Winds Chart (code EL-COG-3112) is a 70 x 100 cm geography wall chart on atmospheric pressure and the winds it drives, used in school and college physical geography lessons and geography labs. It is listed in two versions: English only, and a laminated chart with English and Hindi combined. It is made by Jain Laboratory Instruments Pvt Ltd (JLab) at its works in Ambala, India.
Specifications
| Parameter | Detail |
|---|---|
| Topic | Atmospheric pressure and winds (Charts on Geography series) |
| Chart size | 70 x 100 cm |
| English version | English only (finish confirmed on enquiry) |
| Bilingual version | English and Hindi combined, laminated |
| Maps and diagrams | Not itemised in the listing; a preview image is available on request |
| Quality check | Each chart is visually inspected before dispatch |
| Pack quantity | Each (sold individually) |
| Minimum order quantity | 10 units |
| Dispatch time | Usually 7–10 working days |
| Product code | EL-COG-3112 |
| Manufacturer | Jain Laboratory Instruments Pvt Ltd (JLab) — OEM |
| Country of origin | India (made in Ambala, Haryana) |
What Is the Pressure and Winds Chart Used For?
Air has weight, and the pressure it exerts is measured with a barometer, usually in millibars or hectopascals; it falls with height. Wind is air moving from high pressure towards low pressure, and the Earth’s rotation deflects it — to the right in the Northern Hemisphere and to the left in the Southern — through the Coriolis effect. Globally this gives a pattern of pressure belts (the equatorial low, the subtropical highs, the subpolar lows and the polar highs) with the planetary winds between them: the trade winds, the westerlies and the polar easterlies. Seasonal winds such as the monsoons, and local winds such as land and sea breezes, complete the topic, which appears in the chapter on air in class 7 geography and in atmospheric circulation in class 11.
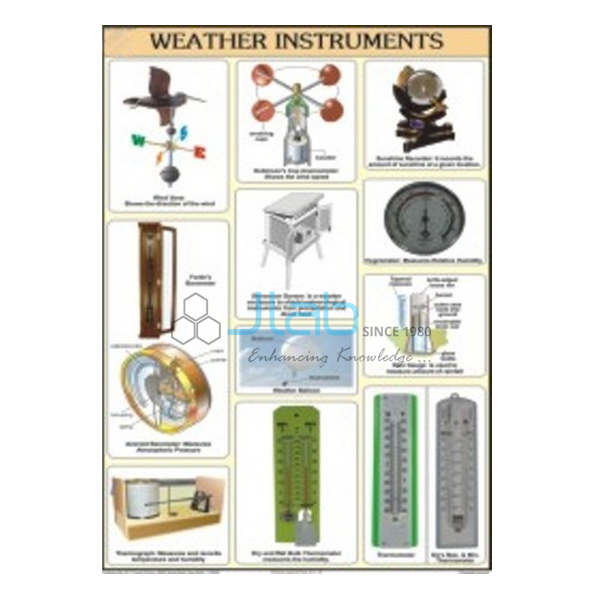
A chart of this size lets a geography teacher keep the whole system in view while students move on to weather maps and to readings with a barometer, anemometer and wind vane. Because the listing does not describe the printed maps and diagrams, ask for a preview image if you need to match a particular textbook.
What to Specify When Ordering
- Version and quantity — English only or the laminated English and Hindi chart; at least 10 charts in total.
- Instruments — a barometer, anemometer or weather vane for practical readings alongside the chart.
- Export details — destination, delivery terms and any labelling or tender reference.
Frequently Asked Questions
What is the Pressure and Winds Chart used to teach?
How air pressure varies and how it drives the winds, from the global pressure belts and planetary winds to seasonal and local winds. Ask JLab for a preview to see the exact panels.
What size is the chart?
It measures 70 x 100 cm.
Is there a Hindi edition?
Yes. One version is laminated and combines English and Hindi; the other is in English only, with its finish confirmed when you enquire.
Are weather instruments included?
No, this listing covers the chart only. Barometers, anemometers and weather vanes are separate items that can be added to the same enquiry.
Who manufactures the chart?
Jain Laboratory Instruments Pvt Ltd (JLab) makes it at its works in Ambala, Haryana, India.
OEM Manufacturer
JLab is the trading name of Jain Laboratory Instruments Pvt Ltd, an Indian manufacturer of geography charts, weather instruments and school laboratory equipment, incorporated in 2017 and based on Hargolal Road, Ambala, Haryana. It makes this chart in its own works rather than buying it from a trader, so schools, colleges, dealers and importers order from the manufacturer, each chart is checked by eye before it leaves, and reorders come from the same works. The company holds MSME Udyam registration UDYAM-HR-01-0003849 (manufacturing enterprise) and is registered under Importer-Exporter Code 3317504552. JLab exports to every region of the world, with destinations such as Ethiopia in East Africa, Angola in Central Africa, the USA in North America, Colombia in South America and Norway in Northern Europe. For tender purchases, see the JLab lab tenders page.
Charts and Instruments for Weather Lessons
- Atmosphere and Space Chart — the layers and make-up of the atmosphere, from the same geography series.
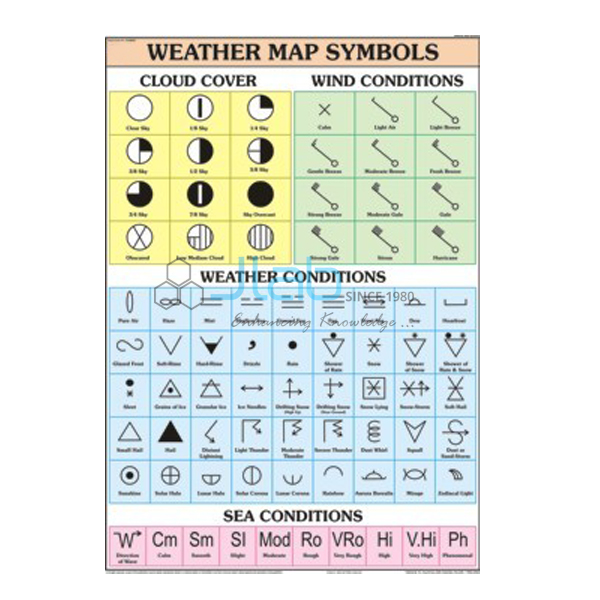
- Weather Map Symbols Chart — the symbols students need to read isobars and wind on a weather map.
- Aneroid Barometer — measures atmospheric pressure.
- Anemometer — a hand-held instrument for wind speed and air temperature.
- Weather Vane — shows wind direction in a school weather station.
See every title in Charts on Geography or the complete Charts range.
Request a Quote
Quotes come straight from the manufacturer. Use the Add To Cart button on this page, or send the version, the quantity (minimum 10 units) and your delivery location through the contact page.
Last updated: 4 October 2026