
November Map Manufacturer,Supplier and Exporter in India
Product Code : EL-WMOI-3171
Jlab Export is a leading November Map Manufacturer,and suppliers in India
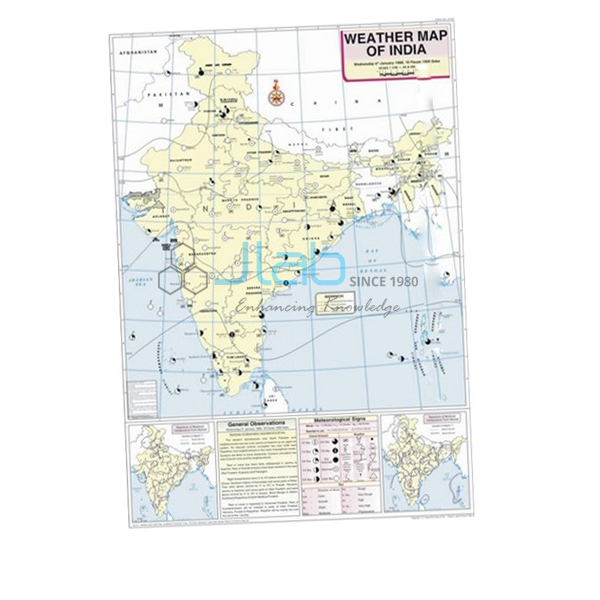
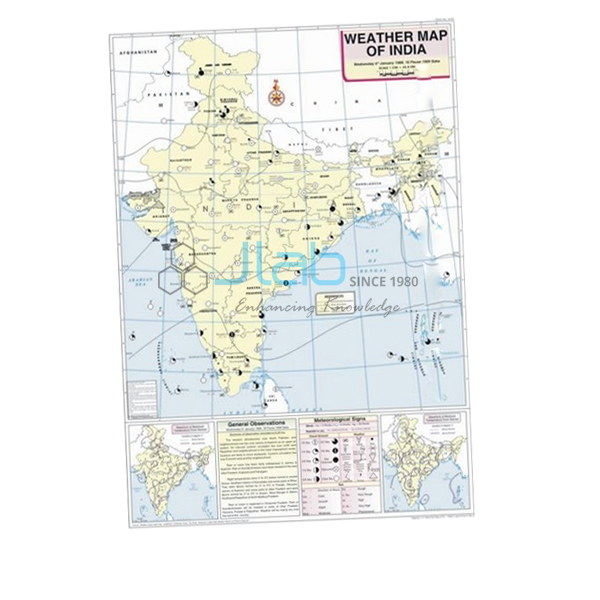
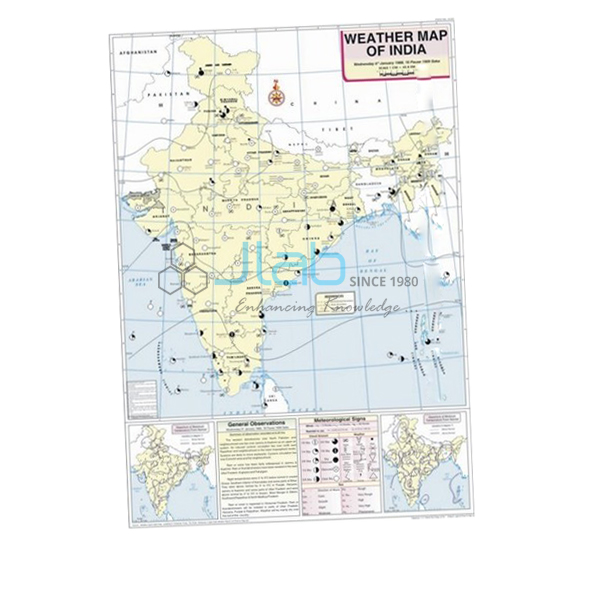
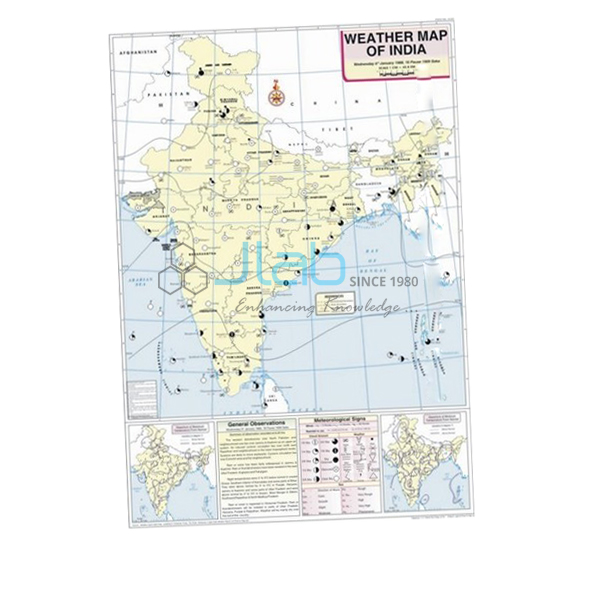
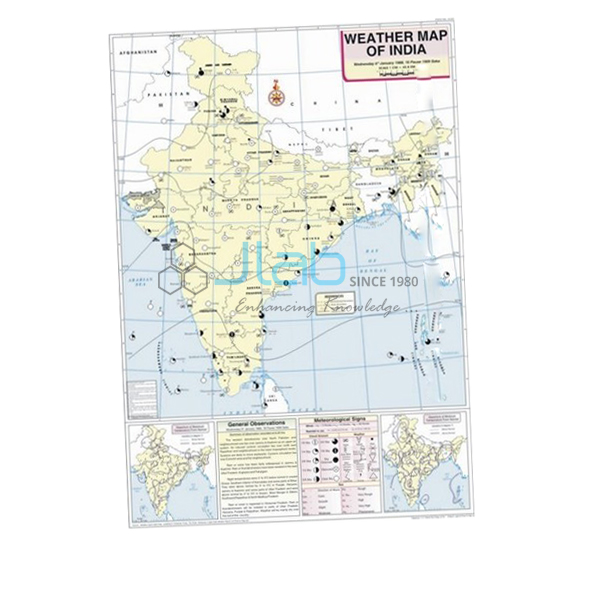
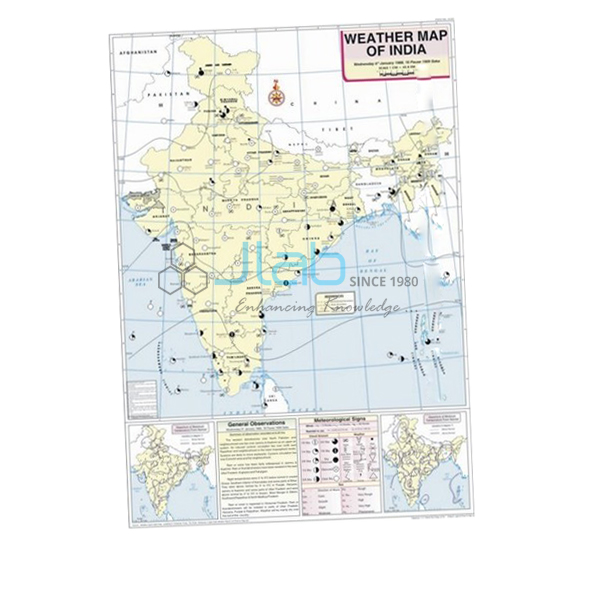
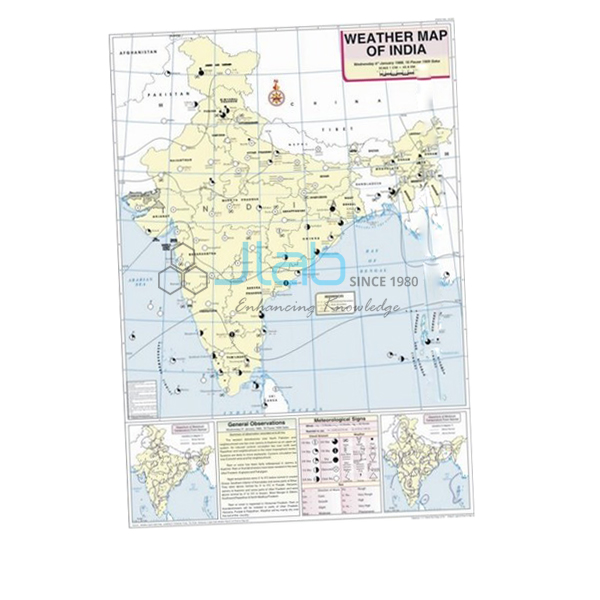
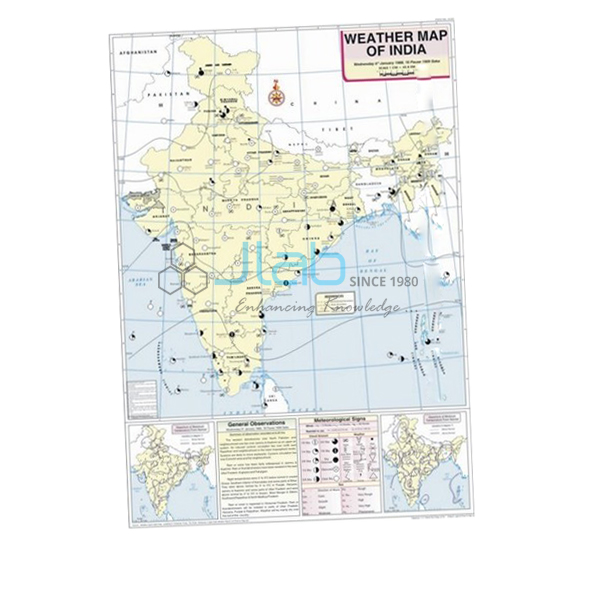
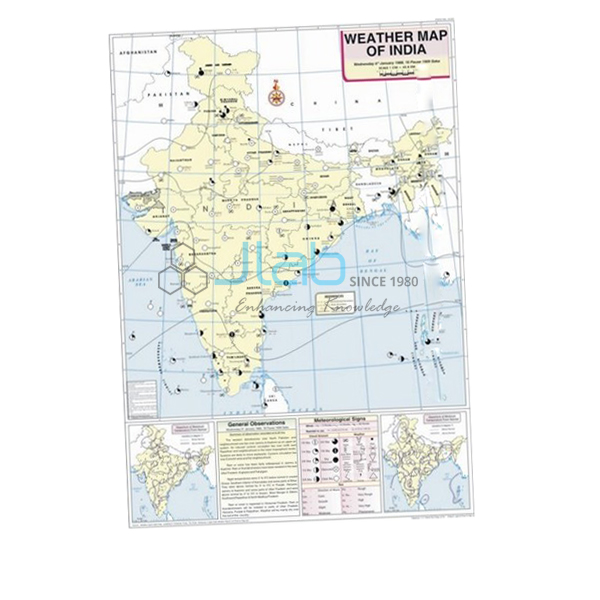
November Map (code EL-WMOI-3171) is a geography wall map showing the weather conditions of a day across India in November, used to teach students how weather is observed, mapped and read. Measuring 70 x 100 cm, it is printed in multicolour on white synthetic polyart sheet with plastic rollers and carries important meteorological stations, maximum and minimum temperatures, isobars and meteorological signs. It is made by Jain Laboratory Instruments Pvt Ltd (JLab) at its works in Ambala, India.
Specifications
| Parameter | Detail |
|---|---|
| Map | Weather map of India, November |
| Details shown | Locations of important meteorological stations in the country; weather conditions of the day and how to record and depict them; maximum and minimum temperature; isobars and meteorological signs |
| Sheet | White synthetic polyart, multicolour print |
| Rollers | Plastic rollers |
| Dimensions | 70 x 100 cm |
| Language | English |
| Quality check | Each map is visually inspected before dispatch |
| Pack quantity | Each (sold individually) |
| Minimum order quantity | 10 units |
| Dispatch time | Usually 7–10 working days |
| Product code | EL-WMOI-3171 |
| Manufacturer | Jain Laboratory Instruments Pvt Ltd (JLab) — OEM |
| Country of origin | India (made in Ambala, Haryana) |
What Is the November Weather Map Used For?
November closes India’s transition from the rainy season to winter, and its weather map is a natural lesson on how winds change direction with the seasons. By early November the low-pressure area that sat over north-west India in summer has moved over the Bay of Bengal, and high pressure builds over the northern plains. The prevailing north-east winds then blow from land to sea over most of the country, so much of India turns dry, but on the Tamil Nadu coast the same winds arrive from the sea and bring rain; cyclonic depressions from the Andaman Sea and the bay add heavy falls along the east coast. In the north, the cold weather season sets in from about the middle of the month.
In the geography lab, students can use the November map to locate the meteorological stations, contrast the maximum and minimum temperatures of northern and southern stations, read the pressure pattern from the isobars, and use the meteorological signs to decide where it is raining and which way the wind is blowing. These are the map-reading skills of the class 11 practical on weather instruments, maps and charts, and the map’s guidance on recording and depicting weather helps students lay out their own daily weather report.
What to Specify When Ordering
- Months — November by itself, or paired with the October and December maps for the change from the post-monsoon season to winter.
- Quantity — minimum order 10 units.
- Language — listed in English.
- Wind instruments — an anemometer or a weather vane if your students will measure wind speed and direction for comparison.
Frequently Asked Questions
What is printed on the November Map?
The important meteorological stations of India, maximum and minimum temperatures, isobars and meteorological signs, along with the weather conditions of the day and how they are recorded and depicted.
Why does Tamil Nadu get rain in November when most of India is dry?
The north-east winds that prevail at this time blow from land to sea over most of the country, but they reach the Tamil Nadu coast after crossing the Bay of Bengal and bring moisture with them. Depressions and cyclones from the bay add to that coastal rain.
What size and material is the map?
70 x 100 cm, printed in multicolour on white synthetic polyart sheet and mounted on plastic rollers.
Is the map suitable for college as well as school use?
Yes, for weather-map reading. It suits the class 11 geography practical and introductory climatology in college; the listing does not describe specialised forecasting content.
Does the order include the October or December map?
No. Each monthly map is a separate catalogue item, so add any other months you need to the same enquiry.
What should I send for an export quotation?
Your quantity, destination country and port or city, delivery terms such as FOB or CIF, packing or labelling needs, and the tender reference if you are buying against a tender.
Who manufactures the November Map?
Jain Laboratory Instruments Pvt Ltd (JLab), at its works in Ambala, Haryana, India.
OEM Manufacturer
JLab is the trading name of Jain Laboratory Instruments Pvt Ltd, incorporated in 2017 and based on Hargolal Road, Ambala, Haryana, where it manufactures geography maps, wall charts and science laboratory equipment for education. Because the November map is made in JLab’s own works and not purchased from a trader, schools, colleges, dealers and importers are supplied factory-direct, each map is looked over before it leaves, and repeat orders are handled by the manufacturer itself. JLab exports worldwide and ships to buyers in every region; examples include Lithuania in Northern Europe, Uzbekistan in Central Asia, Libya in North Africa, Canada in North America and Cameroon in Central Africa. Details for tender buyers are on the JLab lab tenders page.
Neighbouring Maps and Wind Instruments
- October Map — the 70 x 100 cm weather map for the month before.
- December Map — the following month, as winter takes hold.
- Anemometer — a hand-held electronic instrument that measures wind speed and air temperature.
- Weather Vane — shows which way the wind is blowing, mounted on a metal stand.
- Pressure and Winds Chart — explains atmospheric pressure and the winds it produces.
The other months are in the Weather Maps of India category; for every wall chart JLab lists, see Charts.
Request a Quote
JLab answers enquiries for the November map as the manufacturer. Use the Add To Cart button on this page or the contact page, and include the quantity (minimum 10 units), any additional months or wind instruments, and your delivery location.
Last updated: 4 October 2026