April Map Manufacturer,Supplier and Exporter in India
Product Code : EL-WMOI-3164
Jlab Export is a leading April Map Manufacturer,and suppliers in India
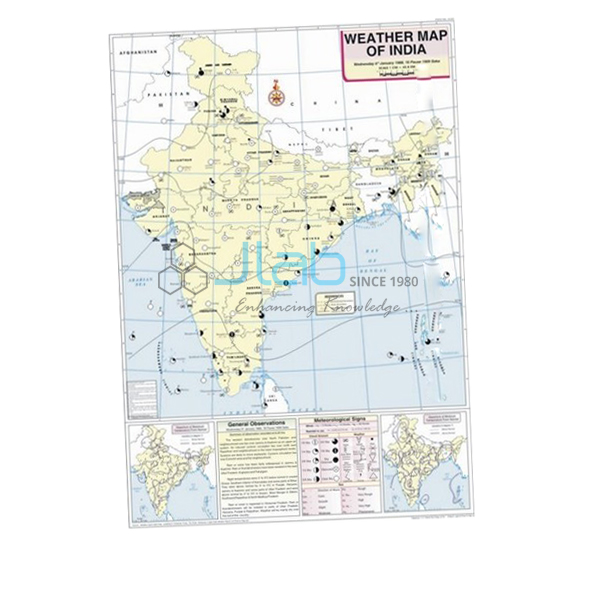
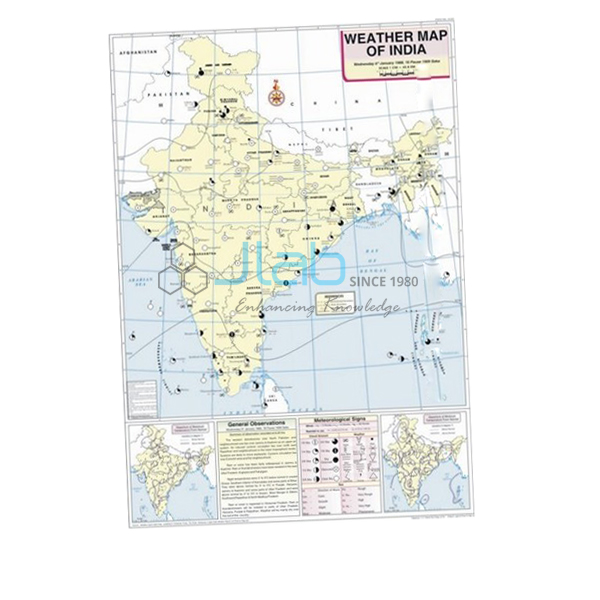
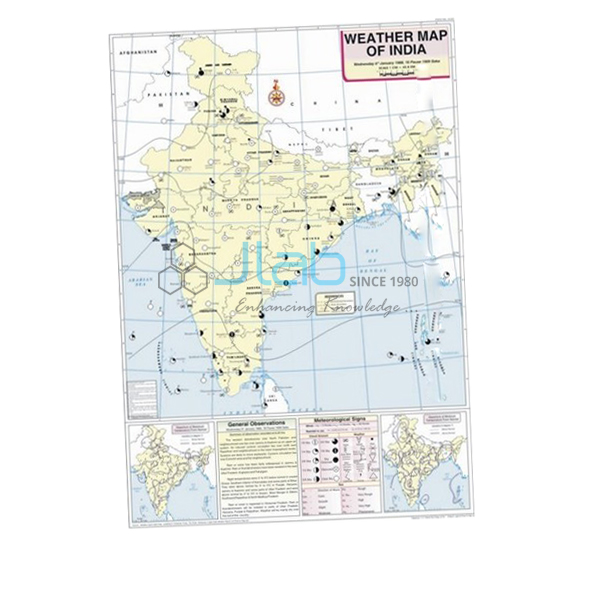
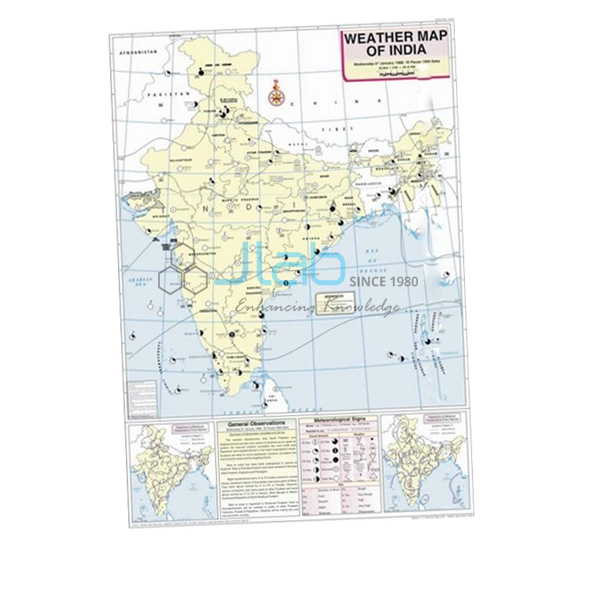
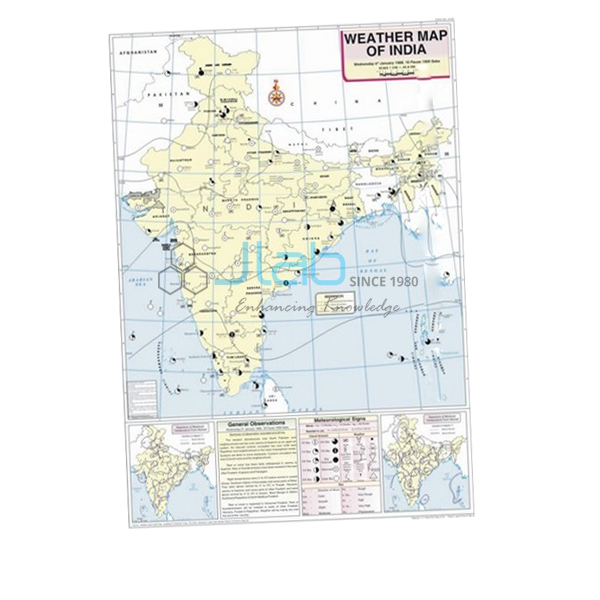
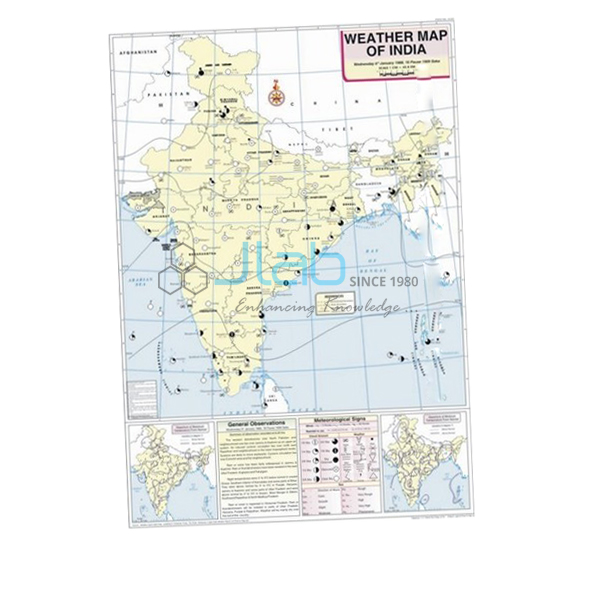
April Map (code EL-WMOI-3164) is a weather map of India for April, made for geography practicals in which students learn to read a day’s weather and record it themselves. Measuring 70 x 100 cm, it is printed in multiple colours on white synthetic polyart sheet with plastic rollers, and shows the important meteorological stations, their maximum and minimum temperatures, isobars and meteorological signs. It is made by Jain Laboratory Instruments Pvt Ltd (JLab) at its works in Ambala, India.
Specifications
| Parameter | Detail |
|---|---|
| Map | Weather map of India — April |
| Features shown | Locations of important meteorological stations in the country; weather conditions of the day and how to record and depict them; maximum and minimum temperature; isobars and meteorological signs |
| Print and sheet | Multicolour on white synthetic polyart sheet |
| Rollers | Plastic rollers fitted |
| Size | 70 x 100 cm |
| Language | English |
| Quality check | Each map is visually inspected before dispatch |
| Pack quantity | Each (sold individually) |
| Minimum order quantity | 10 units |
| Dispatch time | Usually 7–10 working days |
| Product code | EL-WMOI-3164 |
| Manufacturer | Jain Laboratory Instruments Pvt Ltd (JLab) — OEM |
| Country of origin | India (made in Ambala, Haryana) |
What Is the April Weather Map Used For?
April sits in the middle of India’s hot weather season. The belt of highest temperatures moves north from the Deccan into central and northern India, pressure begins to fall over the north-west, and the east sees the first violent evening thunderstorms — the nor’westers, or kalbaisakhi, of West Bengal, Assam and Odisha. Comparing an April map with March and May shows students how the pressure pattern that later draws in the monsoon starts to form.
Working from the map, a class can tabulate the maximum and minimum temperatures of the marked stations, identify the high- and low-pressure areas outlined by the isobars, and interpret the meteorological signs station by station. The map’s note on how weather is recorded and depicted doubles as a template for practical files in class 11 geography and in undergraduate climatology.
What to Specify When Ordering
- Month and quantity — this listing is the April map; the minimum order is 10 units.
- Other months — add the March and May maps, or more, as separate lines of the same enquiry.
- Instruments for fieldwork — a barometer or rain gauge if students will take their own readings.
- Delivery — destination, delivery terms and any tender reference.
Frequently Asked Questions
What is printed on the April Map?
The locations of India’s important meteorological stations, the maximum and minimum temperature recorded at them, isobars and meteorological signs, and an explanation of how the day’s weather is recorded and depicted.
What weather is typical of April in India?
It is part of the hot weather season: temperatures climb across central and northern India, and eastern states often get evening thunderstorms known as nor’westers or kalbaisakhi.
Is the map durable enough for regular class use?
It is printed on white synthetic polyart sheet rather than paper and has plastic rollers, so it can be hung for lessons and rolled up afterwards.
What size and language is it?
It measures 70 x 100 cm and the text is in English.
Who manufactures the April Map?
Jain Laboratory Instruments Pvt Ltd, trading as JLab, at its works in Ambala, Haryana, India.
OEM Manufacturer
JLab is the trading name of Jain Laboratory Instruments Pvt Ltd, a manufacturer of geography maps, charts and laboratory equipment for schools and colleges in India, incorporated in 2017 and based on Hargolal Road, Ambala, Haryana. The April map is made in its own works and not resold from a trader, so dealers, importers and institutions get it factory-direct, every map is visually inspected before dispatch, and follow-up orders come from the same manufacturer. JLab’s registrations include GSTIN 06AADCJ9848D1ZE and the Legal Entity Identifier 549300DTGS77DGYD6N03. JLab exports worldwide and has buyers in every region — for example Bulgaria in Eastern Europe, Fiji in Oceania, Peru in South America, Gambia in West Africa and Oman in the Middle East. Tender details are on the JLab lab tenders page.
Related Weather Maps and Instruments
- March Map — the start of the hot weather season, for comparison.
- May Map — the following month, usually the hottest in the north-west.
- Weather Map Symbols Chart — a key to the signs plotted on weather maps.
- Aneroid Barometer — measures the atmospheric pressure that isobars represent.
- Rain Gauge — lets students compare rainfall between seasons at their own school.
See all months in Weather Maps of India and the full Charts range.
Request a Quote
Quotes come direct from JLab as the manufacturer. Press Add To Cart on this page, or send the months, quantities (minimum 10 units each) and delivery location through the contact page.
Last updated: 4 October 2026