May Map Manufacturer,Supplier and Exporter in India

Product Code : EL-WMOI-3165
Jlab Export is a leading May Map Manufacturer,and suppliers in India
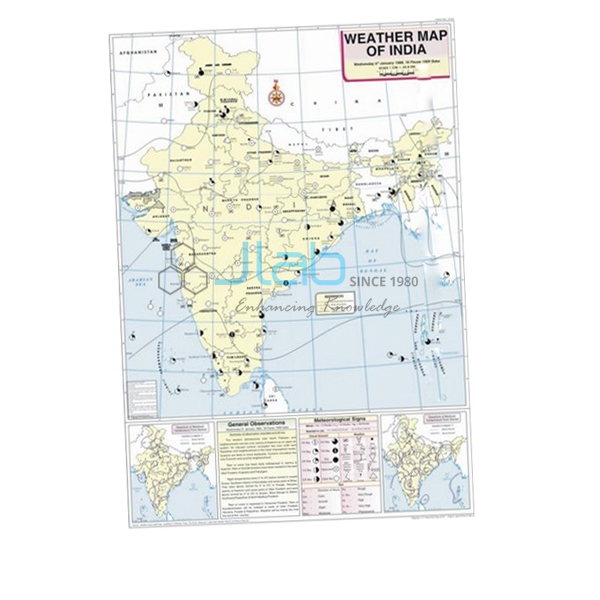
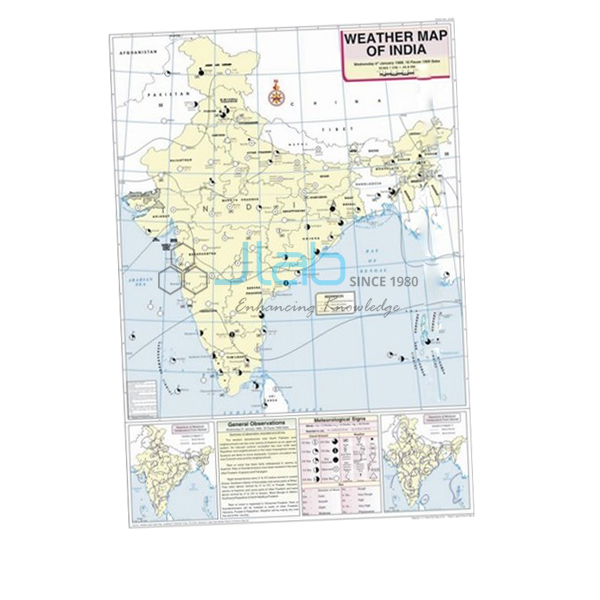
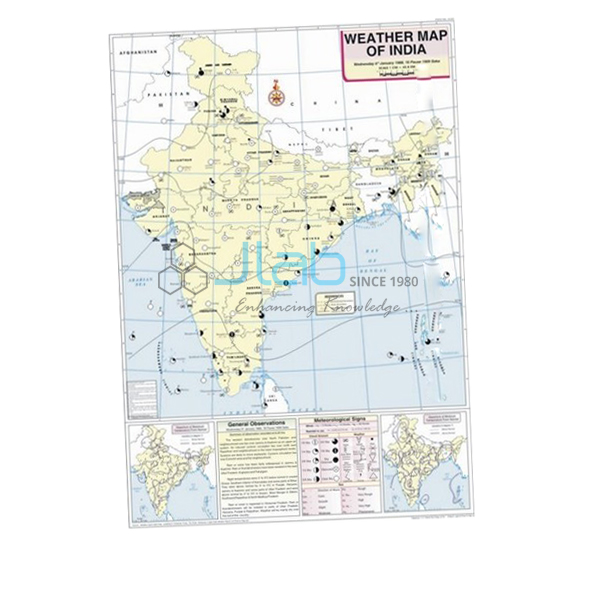
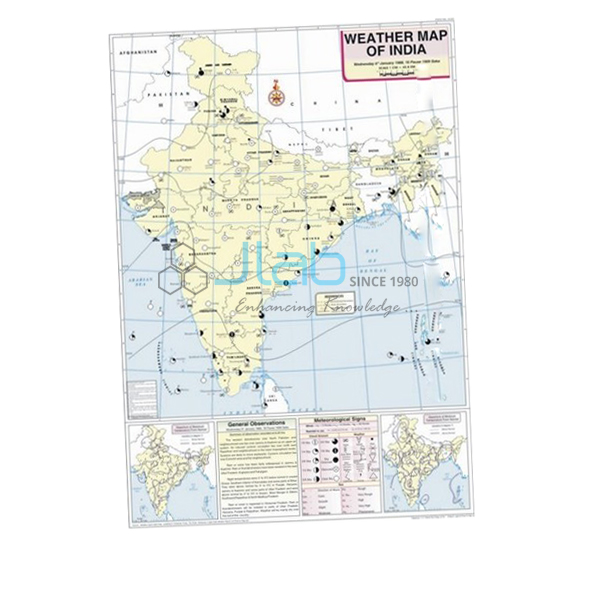
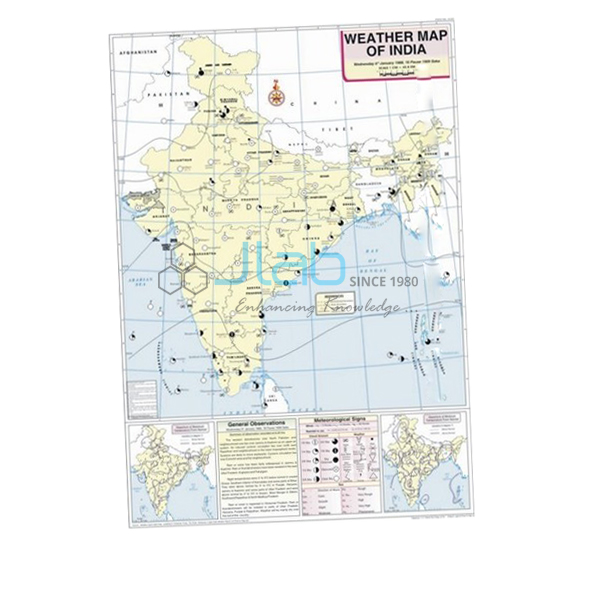
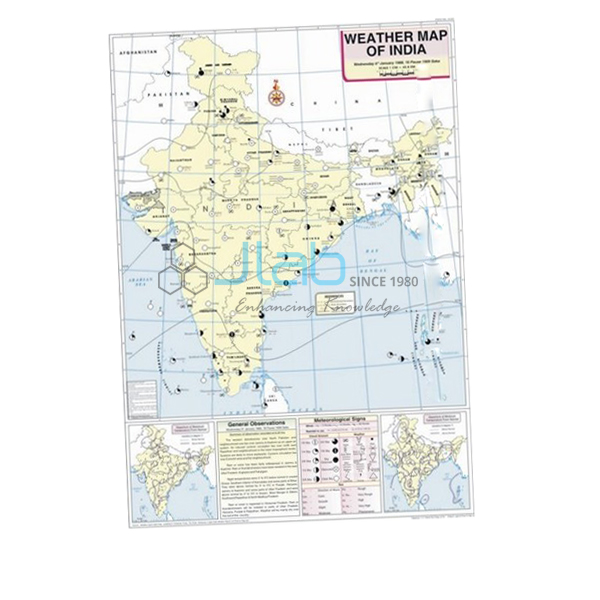
May Map (code EL-WMOI-3165) is a 70 x 100 cm weather map of India for May, used by geography students to interpret and record the weather of a single day. It marks the important meteorological stations with their maximum and minimum temperatures, draws the isobars and uses standard meteorological signs, all printed in colour on white synthetic polyart sheet with plastic rollers and English text. It is made by Jain Laboratory Instruments Pvt Ltd (JLab) at its works in Ambala, India.
Specifications
| Parameter | Detail |
|---|---|
| Map | Weather map of India for May |
| Shows | Important meteorological stations in the country; weather conditions of the day and how to record and depict them; maximum and minimum temperature; isobars and meteorological signs |
| Sheet | White synthetic polyart, multicolour print |
| Rollers | Plastic |
| Size | 70 x 100 cm |
| Language | English |
| Quality check | Each map is visually inspected before dispatch |
| Pack quantity | Each (sold individually) |
| Minimum order quantity | 10 units |
| Dispatch time | Usually 7–10 working days |
| Product code | EL-WMOI-3165 |
| Manufacturer | Jain Laboratory Instruments Pvt Ltd (JLab) — OEM |
| Country of origin | India (made in Ambala, Haryana) |
What Is the May Weather Map Used For?
May is usually the hottest month across northern and north-western India. In the afternoons a hot, dry wind called the loo blows over the northern plains, dust storms are common in Rajasthan, Punjab and Haryana, and a deep area of low pressure forms over the north-west — the heat low that helps draw in the monsoon winds. Further south, pre-monsoon “mango showers” reach the coasts of Kerala and Karnataka, while thunderstorms continue in the east. On a May map students can see where the lowest pressure lies and link it to the highest temperatures.
A typical practical uses the map in three steps: read off the maximum and minimum temperatures at the marked stations, follow the isobars to outline high- and low-pressure areas, then describe the day’s weather from the meteorological signs. The map’s explanation of how weather is recorded and depicted shows students how to set out their answers, as in the weather maps and charts exercises of class 11 geography.
What to Specify When Ordering
- Quantity of May maps — minimum order 10 units.
- Further months — April and June make the clearest comparison either side of the monsoon onset; each is a separate listing.
- Recording equipment — a maximum–minimum thermometer if students will keep their own daily record.
- Delivery — destination and any export terms or tender reference.
Frequently Asked Questions
What information does the May Map carry?
The locations of important meteorological stations in India, maximum and minimum temperatures, isobars and meteorological signs, along with how the day’s weather conditions are recorded and depicted.
Why is May useful for teaching the monsoon?
Because the strong heating of north-west India in May creates the low-pressure area that helps pull the moist south-west monsoon winds towards the subcontinent, so the May map sets up the June and July maps.
What is the loo?
A hot, dry wind that blows over the plains of north and north-west India on summer afternoons, mainly in May and June.
What are the map’s size and material?
It is 70 x 100 cm, printed in colour on white synthetic polyart sheet and fitted with plastic rollers. The text is English.
Who manufactures the May Map?
JLab (Jain Laboratory Instruments Pvt Ltd), at its works in Ambala, Haryana, India.
OEM Manufacturer
JLab is the trade name of Jain Laboratory Instruments Pvt Ltd, an Indian manufacturer whose range covers geography maps and charts as well as science laboratory equipment; it was incorporated in 2017 and works from Hargolal Road, Ambala, Haryana. Because the May map is produced in JLab’s own works rather than bought in from a trader, schools, colleges, dealers and importers deal with the maker, each map is checked visually before dispatch, and repeat orders are made by the same team. JLab exports to every region of the world — Romania in Eastern Europe, Latvia in Northern Europe, Myanmar in Southeast Asia, the Maldives in South Asia and Madagascar in East Africa are a few examples. See the JLab lab tenders page for tender purchases.
Maps and Aids to Use with It
- April Map — the month before, as heat spreads north.
- June Map — the month the south-west monsoon sets in.
- Thermometer Maximum Minimum Indoor or Outdoor — for taking the same maximum and minimum readings at school.
- Weather Instruments Chart — shows the instruments used to measure and record weather.
- Weather Map Symbols Chart — the symbol key for reading the map.
View the whole Weather Maps of India series or the Charts range.
Request a Quote
JLab quotes for this map directly. Use the Add To Cart button on this page, or send the months, quantities (minimum 10 units) and delivery details through the contact page.
Last updated: 4 October 2026