March Map Manufacturer,Supplier and Exporter in India
Product Code : EL-WMOI-3162
Jlab Export is a leading March Map Manufacturer,and suppliers in India
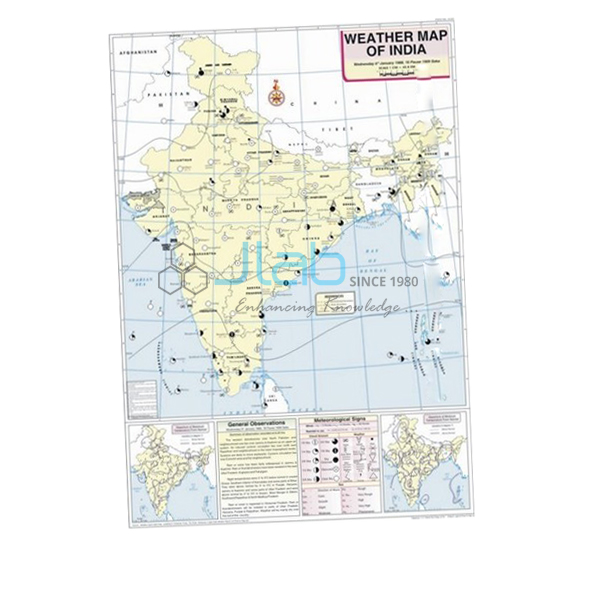
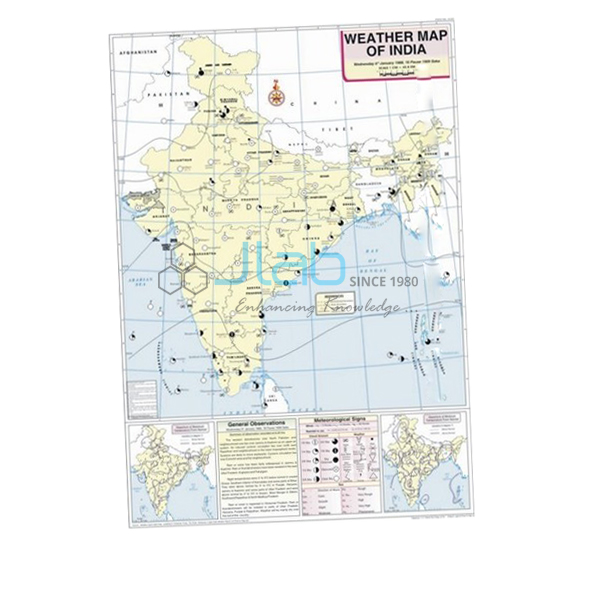
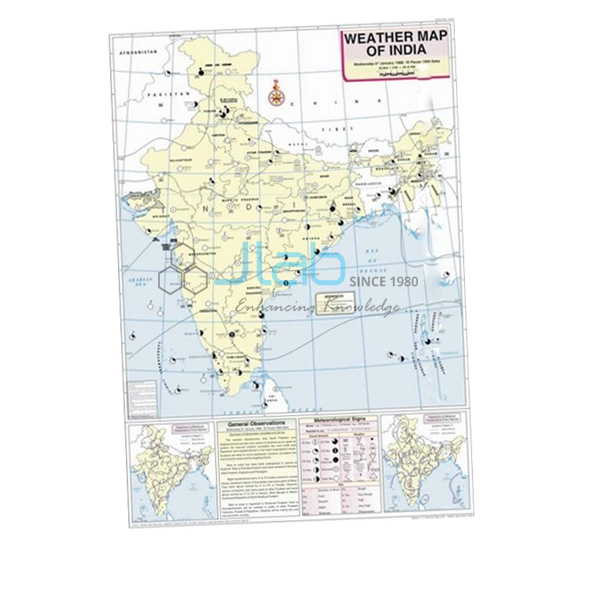
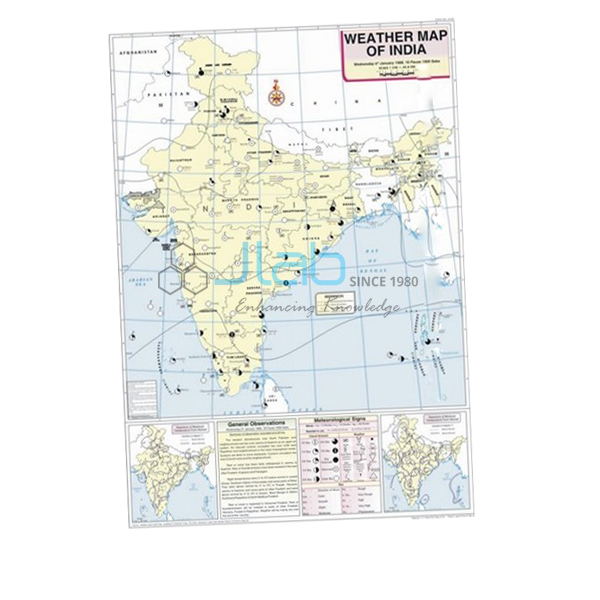
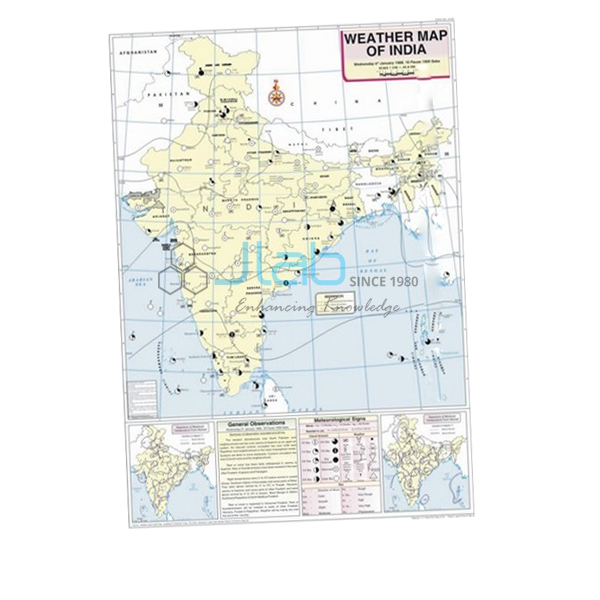
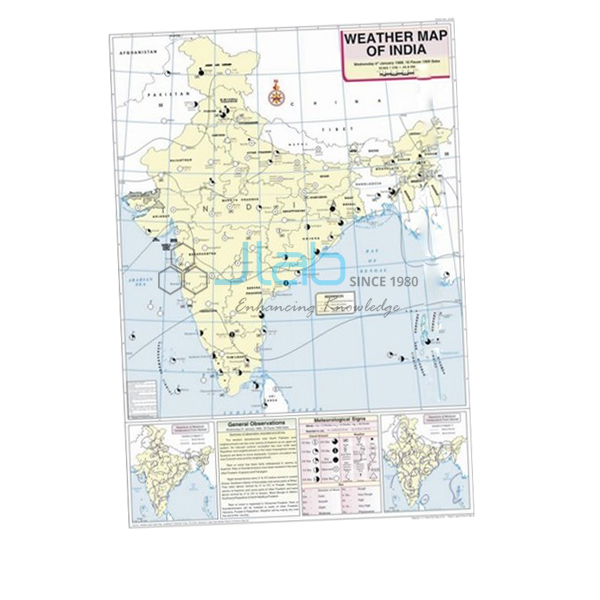
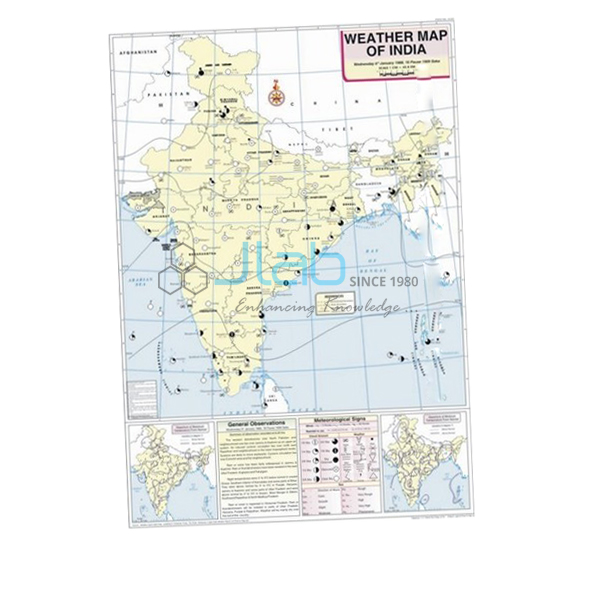
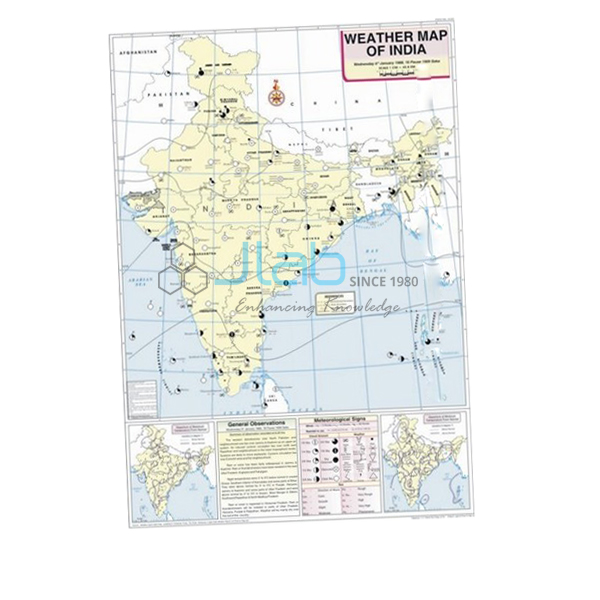
March Map (code EL-WMOI-3162) is a weather map of India for March that geography teachers use to show how a day’s observations from meteorological stations become a finished weather map. The 70 x 100 cm sheet is printed in multiple colours on white synthetic polyart, hangs from plastic rollers and marks stations, maximum and minimum temperatures, isobars and meteorological signs in English. It is made by Jain Laboratory Instruments Pvt Ltd (JLab) at its works in Ambala, India.
Specifications
| Parameter | Detail |
|---|---|
| Map | Weather map of India for March |
| Content | Important meteorological stations in the country; the day’s weather conditions and how to record and depict them; maximum and minimum temperature; isobars and meteorological signs |
| Material | White synthetic polyart sheet, printed in multiple colours |
| Hanging | Plastic rollers |
| Size | 70 x 100 cm |
| Language | English |
| Quality check | Each map is visually inspected before dispatch |
| Pack quantity | Each (sold individually) |
| Minimum order quantity | 10 units |
| Dispatch time | Usually 7–10 working days |
| Product code | EL-WMOI-3162 |
| Manufacturer | Jain Laboratory Instruments Pvt Ltd (JLab) — OEM |
| Country of origin | India (made in Ambala, Haryana) |
What Is the March Weather Map Used For?
March is where the India Meteorological Department’s hot weather, or pre-monsoon, season begins. After the March equinox the Sun’s apparent path moves north of the equator, and the heating shows first over the Deccan plateau while the winter high pressure over the north-west weakens; a late western disturbance can still bring showers to the north. A March map therefore makes a useful contrast with the winter maps on either side of the year.
In a practical lesson students locate the marked stations, list each one’s maximum and minimum temperature, follow the isobars to see where pressure is high or low, and write out what the meteorological signs say about the day’s weather. The map’s own explanation of how weather is recorded and depicted shows them how to lay out the same work in their practical files — part of the weather maps and charts exercises in class 11 geography and in college climatology courses.
What to Specify When Ordering
- Which months — the monthly maps are separate listings, so list each month and quantity.
- Number of March maps — the minimum order is 10 units.
- Supporting charts and instruments — a weather map symbols chart or a maximum–minimum thermometer for the school’s own readings.
- Delivery — destination and delivery terms.
Frequently Asked Questions
What does the March Map show?
Important meteorological stations across India with their maximum and minimum temperatures, isobars and meteorological signs, plus an explanation of how the day’s weather conditions are recorded and depicted.
Which season does March fall in?
The India Meteorological Department counts March as the first month of the hot weather, or pre-monsoon, season, which runs until the monsoon arrives.
How do students use the isobars on the map?
Isobars join places of equal pressure, so students trace them to find areas of high and low pressure and then relate those areas to the temperatures and weather signs at nearby stations.
What is the map made of, and how big is it?
It is printed in multiple colours on white synthetic polyart sheet, fitted with plastic rollers, and measures 70 x 100 cm. The text is in English.
How many must I order, and how soon will they ship?
The minimum order is 10 units, supplied individually, and dispatch is usually within 7–10 working days after a visual check of each map; export transit is additional.
Who manufactures the March Map?
JLab, the trading name of Jain Laboratory Instruments Pvt Ltd, at its works in Ambala, Haryana, India.
OEM Manufacturer
Behind the map is Jain Laboratory Instruments Pvt Ltd, trading as JLab — a manufacturer of geography teaching maps, charts and school laboratory equipment in India, incorporated in 2017 and located on Hargolal Road, Ambala, Haryana. The March map is produced in JLab’s own works instead of being sourced from a trader, which means schools, colleges, dealers and importers order factory-direct, each map is inspected by eye before packing, and repeat supplies come from the same works. JLab exports worldwide, serving buyers in every region — Mongolia in East Asia, Bhutan in South Asia, Hungary in Eastern Europe, Mauritius in East Africa and Latvia in Northern Europe among them. Details for institutional tenders are on the JLab lab tenders page.
Related Weather Maps and Aids
- February Map — the last winter month, for a before-and-after comparison.
- April Map — the next month, as the hot season builds.
- Weather Map Symbols Chart — explains the symbols used on weather maps.
- Weather Instruments Chart — introduces the instruments that take the readings.
- Thermometer Maximum Minimum Indoor or Outdoor — lets students record maximum and minimum temperature themselves.
Browse the Weather Maps of India range or all Charts.
Request a Quote
JLab quotes as the manufacturer. Use the Add To Cart button on this page, or send the months you need, the quantity of each (minimum 10 units) and your delivery location through the contact page.
Last updated: 4 October 2026