October Map Manufacturer,Supplier and Exporter in India
Product Code : EL-WMOI-3170
Jlab Export is a leading October Map Manufacturer,and suppliers in India
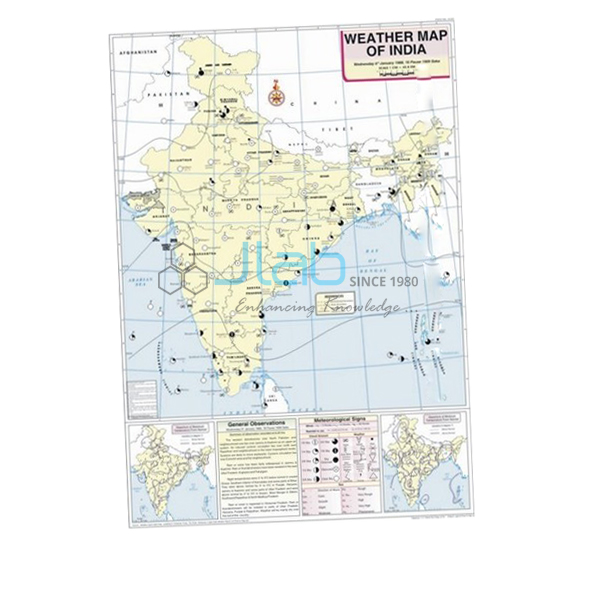
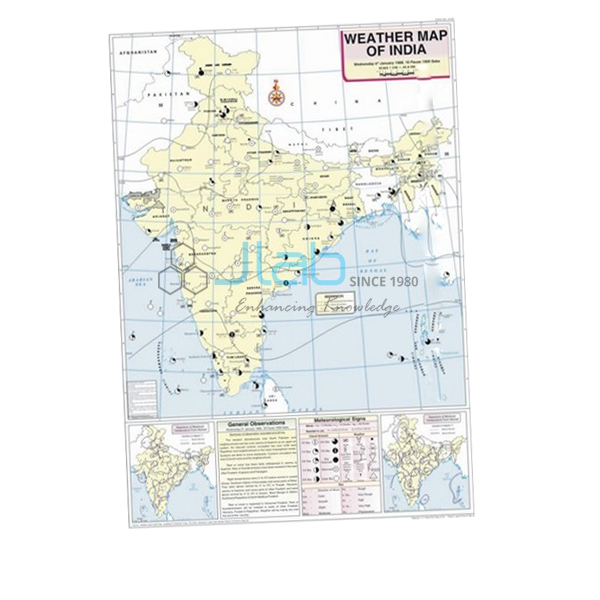
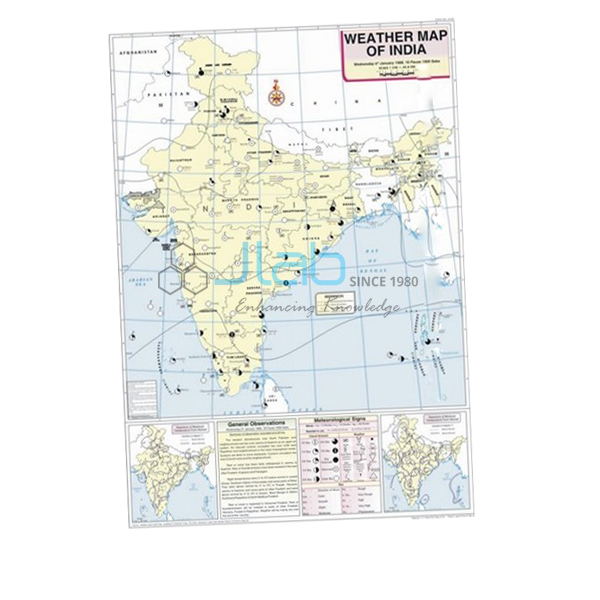
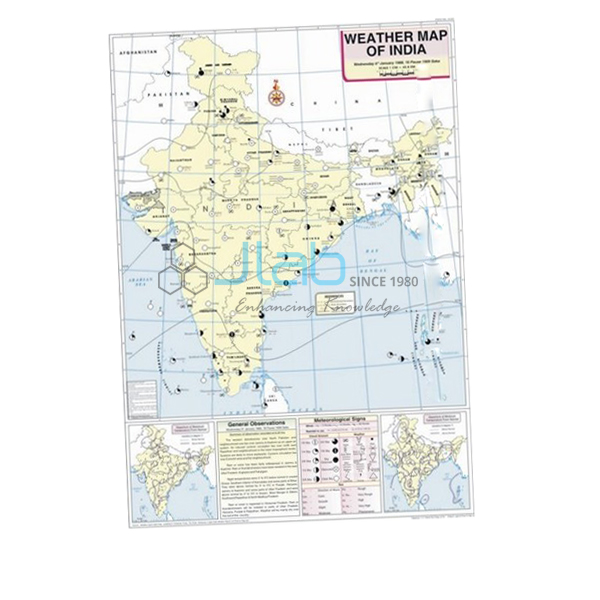
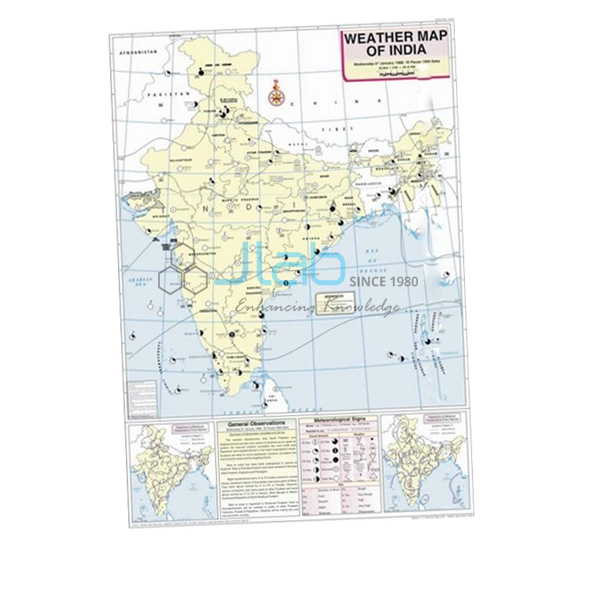
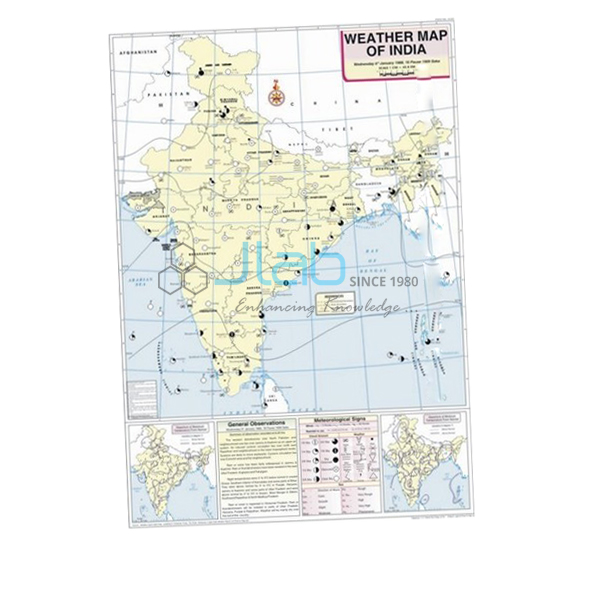
October Map (code EL-WMOI-3170) is a printed weather map of India for October, used in school and college geography to practise reading a day’s weather from a map and recording it correctly. The 70 x 100 cm sheet is white synthetic polyart printed in multicolour, fitted with plastic rollers, and shows important meteorological stations, maximum and minimum temperatures, isobars and meteorological signs. Jain Laboratory Instruments Pvt Ltd (JLab) manufactures it at its works in Ambala, India.
Specifications
| Parameter | Detail |
|---|---|
| Subject | Weather map of India for October |
| Map content | Locations of important meteorological stations in the country; weather conditions of the day and how to record and depict them; maximum and minimum temperature; isobars and meteorological signs |
| Material and print | White synthetic polyart sheet, printed in multicolour |
| Rollers | Plastic |
| Size | 70 x 100 cm |
| Language | English |
| Quality check | Each map is visually inspected before dispatch |
| Pack quantity | Each (sold individually) |
| Minimum order quantity | 10 units |
| Dispatch time | Usually 7–10 working days |
| Product code | EL-WMOI-3170 |
| Manufacturer | Jain Laboratory Instruments Pvt Ltd (JLab) — OEM |
| Country of origin | India (made in Ambala, Haryana) |
What Is the October Weather Map Used For?
October is the start of the transition, or post-monsoon, season in India, and that makes its weather map a good one for showing change. By early October the monsoon has normally left the northern plains; the low-pressure trough that dominated the summer weakens and high pressure begins to take its place. Skies clear, days stay hot and humid while nights turn cooler — the “October heat” described in the class 9 geography chapter on climate — and later in the month temperatures start to fall across north India. Towards the end of the season the low-pressure area moves over the Bay of Bengal, where cyclonic depressions can form and cross the east coast with heavy rain.
With the October map on the wall, students can test those ideas against real data: compare each station’s maximum and minimum temperature to see how wide the day–night range has become under clear skies, follow the isobars to find where high pressure is building, and read the meteorological signs for cloud, wind and rain. The map’s explanation of how a day’s weather is recorded and depicted doubles as a template for the weather chart in a class 11 geography practical file.
What to Specify When Ordering
- Month set — the October map alone, or with the September and November maps to cover the retreat of the monsoon from start to finish.
- Quantity — a minimum of 10 units applies.
- Language — English is the language listed for this map.
- Related equipment — a maximum–minimum thermometer if students will record their own daily temperature range.
Frequently Asked Questions
What does the October Map show?
Important meteorological stations in India, maximum and minimum temperatures, isobars and meteorological signs, with guidance on how the weather of the day is recorded and depicted.
What is the “October heat”?
The hot, humid daytime weather that follows the monsoon’s retreat: skies are clear and the ground is still moist, so days feel oppressive even though nights become cool and pleasant.
Why do cyclones affect the east coast around October and November?
As the monsoon withdraws, the area of low pressure shifts over the Bay of Bengal. Cyclonic depressions that develop there can move onto the eastern coast and bring heavy, widespread rain.
What are the size and finish of the map?
It is 70 x 100 cm, printed in multicolour on white synthetic polyart sheet, with plastic rollers.
Are other months or a thermometer included?
No. This listing covers the October map only. Maps for other months and weather instruments are listed separately and can be quoted on the same enquiry.
What information speeds up an export quotation?
The quantity, the destination country and port or city, your delivery terms (FOB or CIF, for example), any packing or labelling instructions, and the tender reference where relevant.
Who is the manufacturer?
JLab, the trading name of Jain Laboratory Instruments Pvt Ltd, which makes the October map at its works in Ambala, Haryana, India.
OEM Manufacturer
The October map is made by JLab, the trading name of Jain Laboratory Instruments Pvt Ltd — an educational equipment and wall-chart manufacturer in India, incorporated in 2017, whose works are on Hargolal Road, Ambala, Haryana. Production stays in-house rather than going through traders, so schools, colleges, dealers and importers order factory-direct, each map is inspected before it is packed, and further months or replacements come from the same manufacturer. JLab exports worldwide and can ship to buyers in every region — for instance the USA in North America, Mauritius in East Africa, South Korea in East Asia, Bangladesh in South Asia and Malta in Southern Europe. Tender buyers can refer to the JLab lab tenders page.
Post-Monsoon Maps and Temperature Aids
- September Map — the month when the monsoon begins to withdraw, in the same 70 x 100 cm format.
- November Map — the next weather map in the series.
- Thermometer Maximum Minimum Indoor or Outdoor — records maximum and minimum temperature on LCD screens, reading in °C and °F.
- Weather Instruments Chart — introduces the instruments used to measure and record the weather.
See the complete Weather Maps of India series or browse all Charts.
Request a Quote
You get your quotation directly from the manufacturer. Press Add To Cart on this page, or write through the contact page with the number of October maps (minimum 10 units), any other months or instruments, and the delivery address or port.
Last updated: 4 October 2026