Denudation Chart Manufacturer,Supplier and Exporter in India
Product Code : EL-CFOTE-3148
Jlab Export is a leading Denudation Chart Manufacturer,and suppliers in India
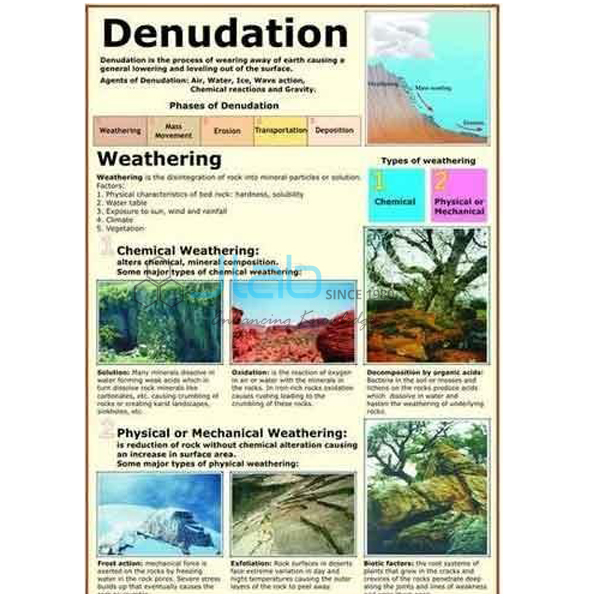
Denudation Chart (code EL-CFOTE-3148) is a laminated 50 x 75 cm physical geography chart showing weathering and the chemical and physical effects of erosion — the processes that together wear down the land surface. It is printed in multicolour with English and Hindi on the same sheet and hangs on plastic rollers for classroom display. It is made by Jain Laboratory Instruments Pvt Ltd (JLab) at its works in Ambala, India.
Specifications
| Parameter | Detail |
|---|---|
| Topic | Weathering, and the chemical and physical effects of erosion |
| Printing | Multicolour on 80 gsm map litho paper |
| Size | 50 x 75 cm |
| Lamination | Hot seal polyester film on both sides |
| Rollers | Plastic rollers fitted at top and bottom |
| Language | English and Hindi combined |
| Quality check | Each chart is visually inspected before dispatch |
| Pack quantity | Each (sold individually) |
| Minimum order quantity | 10 units |
| Dispatch time | Usually 7–10 working days |
| Product code | EL-CFOTE-3148 |
| Manufacturer | Jain Laboratory Instruments Pvt Ltd (JLab) — OEM |
| Country of origin | India (made in Ambala, Haryana) |
What Is the Denudation Chart Used For?
Denudation is the general wearing down of the land by weathering, mass movement and erosion working together. Weathering breaks rock down where it lies. Physical weathering splits it without changing its minerals — water freezing and expanding in cracks, outer layers peeling off rock that is heated by day and cooled at night in deserts, and salt crystals growing in pores. Chemical weathering changes the minerals themselves: rainwater carrying dissolved carbon dioxide slowly dissolves limestone into caves, iron-bearing minerals oxidise to reddish compounds, and feldspar in granite turns to clay. Plant roots and burrowing animals add biological weathering. Erosion then removes the loosened material by running water, wind, ice and waves. Chemical weathering is fastest in hot, humid climates and physical weathering dominates in cold or dry ones, which is why landscapes differ so much from region to region.
The chart is a reference for geomorphic processes in secondary and senior secondary physical geography and in college earth science. Its individual diagrams are not listed, so ask JLab for an image if you need to confirm how a process is shown.
What to Specify When Ordering
- Quantity — minimum order 10 units.
- Practical work — the Acid Rain, Weathering & Erosion activity, linked below, lets students test chemical weathering for themselves.
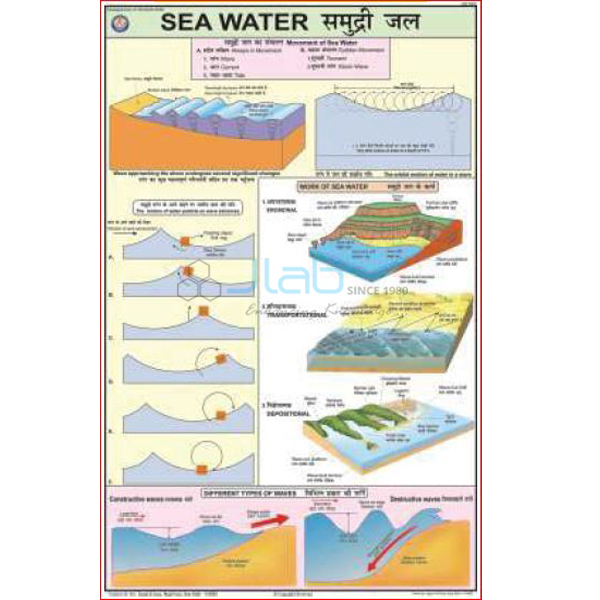
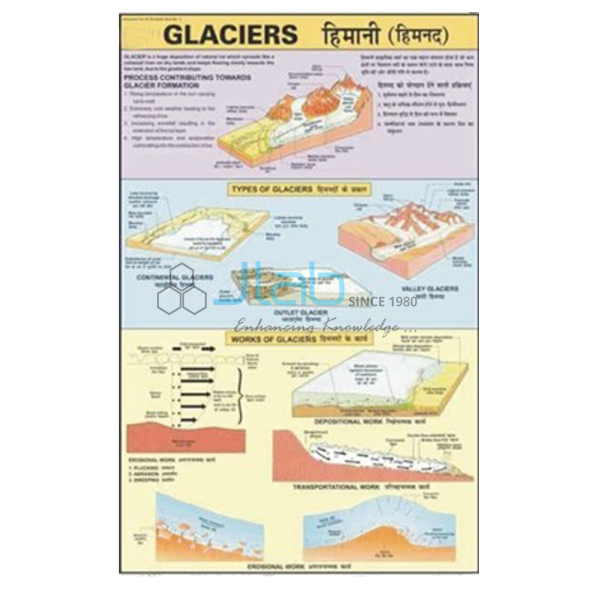
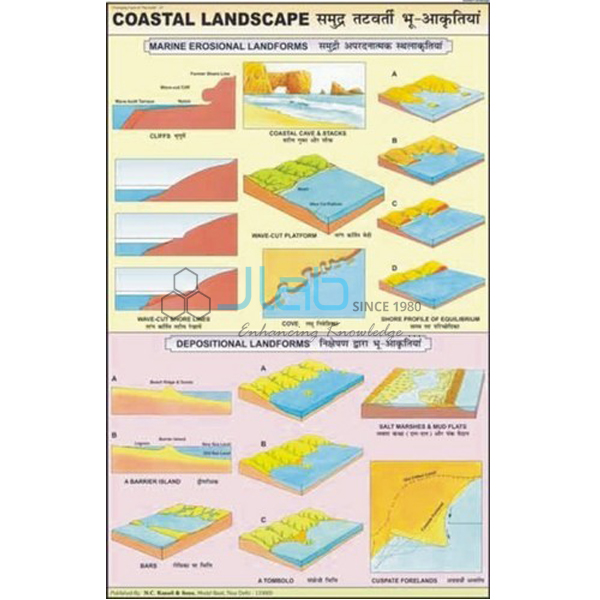
- Agent charts — the river, wind, glacier and sea charts from the same series show erosion by each agent in detail.
- Shipping — destination city and country, delivery terms such as FOB or CIF, and any tender reference.
Frequently Asked Questions
What does the Denudation Chart show?
Weathering, and the chemical and physical effects of erosion. Ask JLab for an image if you need to check the diagrams against your syllabus.
What is the difference between weathering and erosion?
Movement. Weathering breaks rock down in place, while erosion picks up the broken material and carries it away by water, wind, ice or waves. Denudation is the combined result of both.
Why does limestone weather faster than granite?
Limestone is made mainly of calcium carbonate, which dissolves slowly in rainwater made weakly acidic by carbon dioxide. Granite’s quartz resists this, and its feldspar alters to clay far more slowly than limestone dissolves.
What size is the chart and what is it made of?
50 x 75 cm, printed in multicolour on 80 gsm map litho paper, laminated with hot seal polyester film on both sides, with plastic rollers at the top and bottom. It is in English and Hindi combined.
What should I send for an export quotation?
The quantity, the destination country and port or city, preferred delivery terms (for example FOB or CIF), any packing or labelling needs, and the tender reference if one applies.
Who manufactures the Denudation Chart?
Jain Laboratory Instruments Pvt Ltd (JLab), at its works in Ambala, Haryana, India.
OEM Manufacturer
JLab is the trading name of Jain Laboratory Instruments Pvt Ltd, a manufacturer of geography charts, landform models and science lab equipment in India, incorporated in 2017 and based on Hargolal Road, Ambala, Haryana. It holds MSME Udyam registration UDYAM-HR-01-0003849 (manufacturing enterprise) and Importer-Exporter Code 3317504552. The Denudation Chart is made at JLab’s own works and not bought in from a trader, so schools, colleges, dealers and importers buy from the producer, each chart is visually inspected before dispatch, and repeat orders are handled by the manufacturer. JLab exports worldwide and ships to buyers in every region — the UAE in the Middle East, Mongolia in East Asia, Bolivia in South America, Belize in Central America and the Caribbean, and Tanzania in East Africa, for example. Tender information is on the JLab lab tenders page.
Weathering and Erosion Teaching Aids
- Acid Rain, Weathering & Erosion — an activity on how acid rain affects natural rock surfaces and man-made surfaces.
- Cycle of Erosion 3D Model — a framed rigid PVC model with a markable, washable surface.
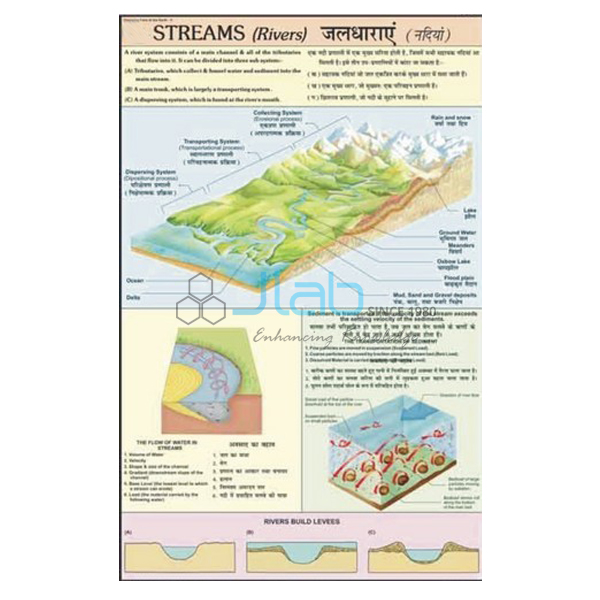
- Rivers Landscape Chart — erosion and depositional landforms made by rivers.
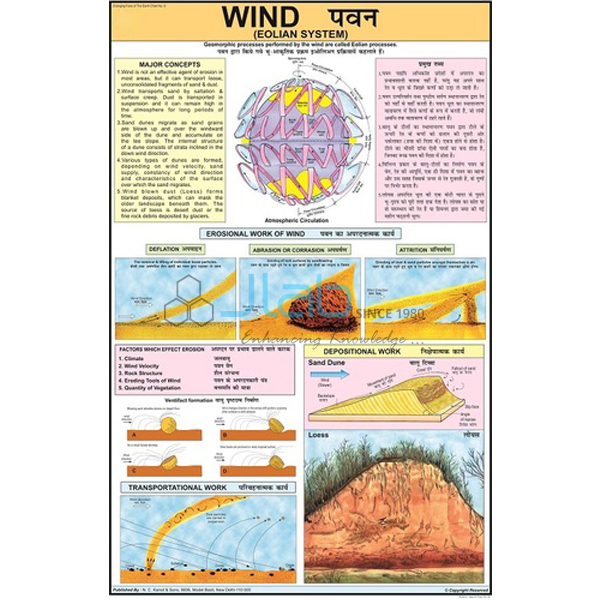
- Wind Eolian System Chart — how wind acts on the Earth’s surface.
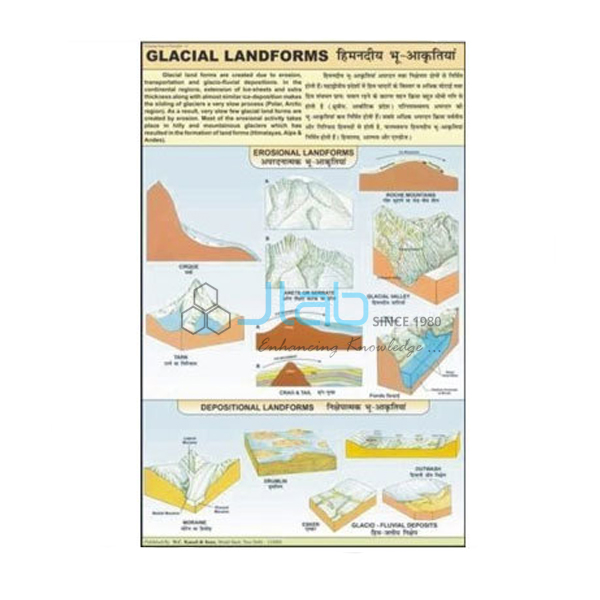
- Glacial Landform Chart — landforms created by glacial erosion, transportation and deposition.
See the whole Changing Face of the Earth series or browse all Charts.
Request a Quote
Quotes come directly from the manufacturer. Use the Add To Cart enquiry button, or send the number of charts (minimum 10 units), any companion charts or activities, and the delivery destination through the contact page.
Last updated: 3 October 2026